Washington Post-A flood of problems
Peru’s glaciers have made it a laboratory for adapting to climate change. It’s not going well.
Story by Nick Miroff, Photos by Jabin Botsford August 7, 2017
 An Andes mountain range and a cross headstone are seen from Cementerio Municipal De Huaraz in Huaraz, in the Ancash region of Peru, on July 13.
LAKE PALCACOCHA, Peru
After a day of bright sunshine, a chunk of ice the size of a dump truck broke off the glacier on Mount Pucaranra a few weeks ago. It plunged into the lake below and kicked up a wave nine feet high.
Victor Morales, a small, catlike man with a tattered ski cap who is the lake’s solitary watchman, scrambled up to a stone hut on the side of the mountain and got on the radio. The wave had damaged an emergency drainage system meant to reduce the volume of the lake. But to his great relief, the earthen dam holding back the water was intact.
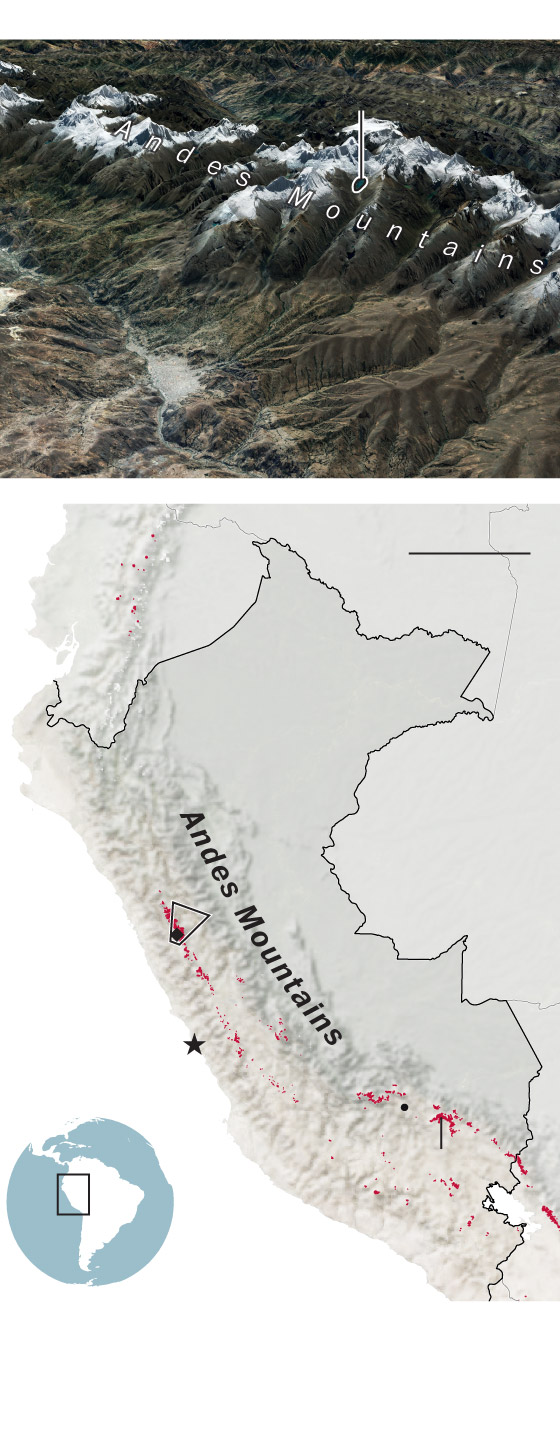 Sources: National Snow and Ice Data Center, Google Earth
Above: An Andes mountain range and a cross headstone are seen from Cementerio Municipal De Huaraz in Huaraz, in the Ancash region of Peru, on July 13.
“It wasn’t a big avalanche,” Morales said.
Lake Palcacocha is a mile long and 250 feet deep, and the effect of a large avalanche would be similar to dropping a bowling ball in a bathtub. Modeling scenarios predict a 100-foot wave so powerful it would blow out the dam. Three billion gallons of ice water would go roaring down the mountain toward the city of Huaraz, burying its 200,000 residents under an Andean tsunami of mud, trees and bouldersSources: National Snow and Ice Data Center, Google Earth
Lake Palcacocha is an example of the immediate threats Peru and other developing countries are facing from climate change. The country is especially vulnerable since it is home to 70 percent of the world’s “tropical glaciers” — small, high-altitude ice caps found at the earth’s middle latitudes. Their disappearance has made Peru something of a laboratory for human adaptation to climate change.
So far, it’s not going very well.
“For countries like Peru that are trying to climb out of poverty, there are major social, cultural and economic obstacles to adaptation,” said Nelson Santillán, a researcher at Peru’s national water authority. “Identifying risks is one thing, but doing something about them is another.”
In the weeks since President Trump announced the United States would renege on its commitment to the Paris climate accord, scientists have pointed to new signs the planet is edging closer to a precipice. Maximum temperature records continue falling. New cracks are opening at the polar ice caps.
Peru’s high-altitude glaciers are tiny by comparison, but millions of people depend on their runoff for water, food and hydroelectricity.
Some of Peru’s glaciers have lost more than 90 percent of their mass. While much of the water trickles harmlessly down the mountainside, in places like Lake Palcacocha, it is pooling in great big puddles of melted ice. Many of these new lakes are held back by glacial moraines, which are essentially mounds of compressed sediments. They may be structurally weak, and as the volume of water pushing on them increases, some will collapse.
“We have glaciers across 19 — no, 18 — mountain ranges,” said Marco Zapata, the head of Peru’s institute for glacier research, correcting himself to reflect the latest monitoring data.
“They’re all shrinking.”
For Peruvian authorities, this is becoming more of an engineering problem than an environmental lament. Without reliable glacial runoff, the country’s water and irrigation systems will need to be retooled. New dams and reservoirs will be needed to more effectively store water. Investments in agriculture and other water-intensive industries will need to be recalculated.
“The glacier used to come down to there,” said Tomás Rosario, 45, who farms in the shadow of 22,000-foot Huascaran, Peru’s highest peak. He pointed at a ridge above his village, where bare rock was exposed. “Now the snow is gone and we’re running out of water.”

Victor Morales, the solitary watchman whose job is to call the city of Huaraz to warn of potential floods, waits for breakfast in his stone hut near Lake Palcacocha, a swollen glacial lake in the Andes mountain range.
Drought’s dire impact
Last November, in the middle of a crippling drought, a rumor began to spread in Rosario’s tiny town of Soledad and in other Quechua-speaking villages whose residents grow potatoes and corn on the flanks of mountains here.
The rainy season was late, the fields were parched and livestock were dying. The government said global warming was making matters worse.
The villagers, not unlike climate-change skeptics in the United States, did not believe it.
Their suspicions fell instead on the strange machines that foreign scientists and aid workers from the nonprofit group CARE Peru had installed with great fanfare at Lago 513, another swollen glacial lake not far from Lake Palcacocha.

Alejandro Rosales, 61, talks about about his poor corn harvest this year because of low rainfall. He wants the regional government to complete an irrigation project that would grant his town access to more water from the glacial runoff in Yarush.
The $250,000 emergency warning system included a monitoring station to alert residents living downstream in the town of Carhuaz (population 13,000) in case of a dam rupture. A 2010 flood triggered by an icefall at Lago 513 destroyed dozens of homes.
But in the middle of a drought, no one was especially worried about flooding. Years of disappointing rainfall were sowing anxieties up and down the valley.
Then the rumors picked up. “Everyone was saying that the gringos’ machines were scaring away the rain,” said Feliciana Quito, who farms a small plot downstream from the lake.
Jesús Caballero, the Carhuaz mayor, said he wanted to set the villagers straight, so he offered to hike up to the lake one morning in November to show them the “gringo machines” were harmless.
But when Caballero arrived at the lake that day, he said, it was clear the villagers were not interested in a climate lecture. Some of the young men were carrying sticks. This was a lynch mob.
“I told them the equipment had nothing to do with the rain,” Caballero said. “But I was rowing against the current.”
The villagers attacked the monitoring station, tearing out the antennas and solar panels. They bludgeoned some of the instruments and carried the rest back down the mountain, triumphant, as if they had slayed a dragon.
The rains came three days later, ending the drought. The villagers were jubilant. Their climate science was vindicated.
But now the lake has no emergency warning system in case the dam bursts. The farmers say they will not allow the foreigners to put the equipment back in, let alone drive through their village. When CARE Peru sent a team to inspect the damage, they were stopped on the road by women carrying rocks, threatening to stone them.
“We’re not going to let anyone put anything up there that interferes with the rain,” said Rosario, who was one of the expeditionaries who went to the lake that day.
Caballero said the episode has demonstrated the need for greater sensitivity to the fears of rural villagers whose lives and traditions are upended by water shortages and extreme weather.
What is left of the old monitoring system is now locked in a storage room opposite the Carhuaz city hall. Caballero said he thinks he can get the villagers’ approval to put the equipment back in if there is another drought this fall, because it would prove his point that the machines have nothing to do with the rain.
Then again, he said, the villagers may direct their anger at the emergency monitoring systems installed at other nearby lakes, such as Lake Palcacocha. “If the rains don’t come, I worry they’ll march up there and tear the other equipment out, too,” he said.


A sheep joins a group of people as they sit at an overlook in Huaraz. Police officers cordon off streets during a drill to prepare for a potential flood triggered by a dam rupture at the swollen glacial lake upstream in Huaraz. People make their way through the market near Plaza de Armas in Carhuaz.
Population boom
It would be especially unwise to attack the monitoring station at Lake Palcacocha.
A moraine dam at the lake collapsed in December 1941, and the flood it unleashed killed several thousand people in Huaraz. The city only had 17,000 residents at the time. Since then its population has exploded, as farmers in the surrounding hills have been lured to the city by jobs in mining and tourism.
Land was cheap along the riverbanks, and today the flood zone is the most heavily populated part of the Huaraz, with schools, hospitals and a stadium.

Siphon pipes lead up the mountain to Lake Palcacocha. The siphons were installed to reduce the lake’s volume and to prevent a dam rupture. Nonetheless, the siphons were damaged in the recent icefall, and only a pair remains in operation.
The Peruvian government launched dozens of flood control projects across the Andes after the 1941 disaster, adding an emergency spillway at Lake Palcacocha. When a 7.9 earthquake hit in 1970 and much of Huaraz was destroyed again, thousands died, but the dam held.
But since then the volume of the lake has increased 34-fold as glacial melting accelerates. Lake Palcacocha rose so high in 2011 that authorities declared an emergency, and soon after a series of flexible plastic pipes were installed to siphon off water from the surface like giant soda straws.
The siphons lowered the height of the lake by nearly 20 feet, but they were damaged in recent icefall, and only two are now working.
A major avalanche would toss the pipes from the lake like wet noodles, and the spillway tunnel that is the dam’s last safety valve would be quickly clogged with rock and ice.
Draining the lake to a safer level can be done with relatively simple engineering techniques that would cost only about $7 million, environment ministry officials say. In contrast, a dam failure and catastrophic flooding in Huaraz would inflict more than $2.5 billion in damage, in addition to causing thousands of deaths.
But fixing Palcacocha has become a source of fierce debate. The lake is inside a national park, where big engineering projects are not welcome. While the central government in Lima is eager to drain the lake, local farmers say they need the water, and want new reservoirs that would store it elsewhere and redistribute the load.
These proposals are muddied by deep distrust. The last three regional governors from Huaraz have been jailed on graft charges, and the reputation of the central government in Lima isn’t much better, as two former presidents are also under indictment for corruption.
While the threats of climate change are new, the shortcomings of the political system are not, said Jahir Anicama, head of the CARE Peru office in Huaraz. “In the end, it’s a matter of effective government,” he said.
Officials and aid groups have been focused on disaster prevention, but he said the latest conflicts show the need to address the full range of fears that will probably intensify as the glaciers vanish and water supplies grow more irregular.
“We’ve been focused on future flood risks, but that’s not the biggest worry for these farmers,” he said. “They want projects that give them access to water, and they want them now.”
 The coal-burning Plant Scherer in Juliette, Ga., is one of the top emitters of carbon dioxide in the United States. A draft report by government scientists concludes that Americans are feeling the effects of climate change right now. Credit Branden Camp/Associated Press


 Pushart


 Risa Scott / RF Scott Imagery