AZ Central – The Arizona Republic
Arizona’s 2023 monsoon leaves us wanting more. Why some of us got rain and others didn’t
Kye Graves, Arizona Republic – September 29, 2023
Arizona’s 2023 monsoon season left a lot to be desired, from below-average rainfall numbers across the state to record-setting heat streaks, and the spectacle that often provides widespread relief to the region was sorely missed.
The scope of the season’s impact, while minimal, was exacerbated by the scalding summer conditions and multiple heat records in a slew of categories.
Thunderstorms were hard to come by this year. Rainfall totals for the monsoon season, which ends Sept. 30, will likely result in the driest-ever summer season at Phoenix Sky Harbor International Airport, where the National Weather Service records the official figure. The rain gauge there posted just 0.15 of an inch, less than half the total of 1924, previously the driest with 0.35 of an inch.
Some areas did fare better, primarily in the East Valley and Cave Creek, where some gauges snagged upward of 4 inches, but the spotty season will still place Maricopa County on the infamous dry list behind 2020’s “Nonsoon.”
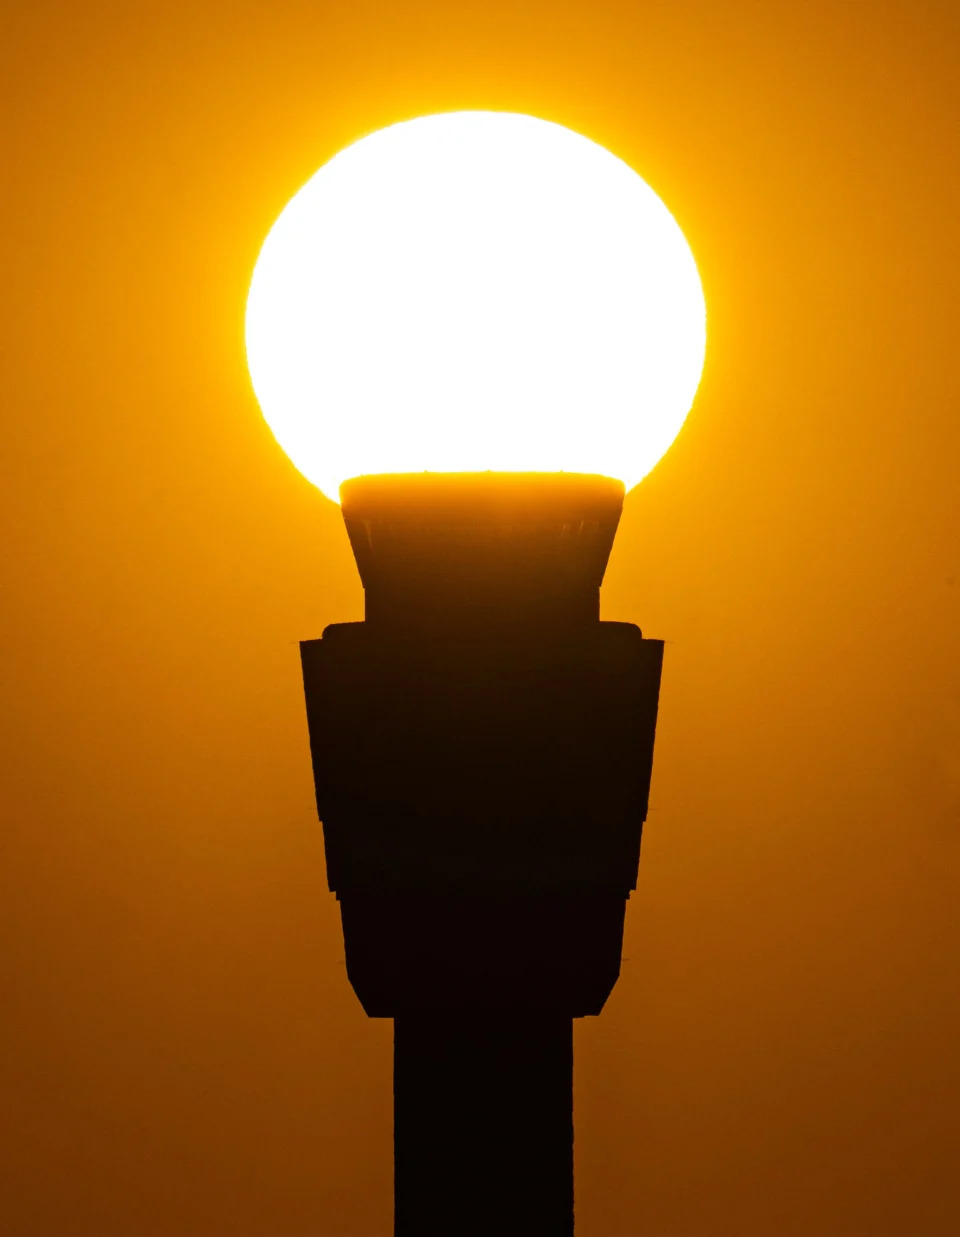
Ultimately, this lack of storms helped fuel the full effect of triple-digit temperatures and the sweltering sun to be felt across the state.
In fact, each of the three branches of the National Weather Service — Flagstaff, Phoenix and Tucson — recorded Julys that surpassed the month in years prior, posting their hottest-ever totals.

Flagstaff sees hottest monsoon season on record; Tucson and Phoenix hottest-ever Julys
Climate summary data from the weather service’s website highlights the month’s ferocity. In the Phoenix area, for example, average high temperatures for July were 114.7 degrees, more than eight degrees above the recorded norm between the years 1991-2020.
The average mean temperature was 102.7 degrees, about seven degrees higher than the recorded norm. The most revealing stat was for warm-lows, as nights in Phoenix averaged 90.8 degrees, more than six degrees north of the month’s typical mean.
For Tucson and Flagstaff, climate reports echo a similar song. Tucson posted its hottest July, with an average monthly temperature of 94.2, six degrees hotter than normal. Flagstaff witnessed its warmest July, with a 4.7-degree temperature spike above its typical mark, bringing the overall average figure for the month to 71.4 degrees.
Flagstaff is on pace for its warmest monsoon season on record by just 0.2 degrees, surpassing the number one spot set in 1980.
Rainfall totals shallow compared to recent years
Total precipitation for 2023’s monsoon, recorded at Phoenix Sky Harbor, Flagstaff Pulliam and Tucson International airports, varied across the board:
- Flagstaff: 4.24 inches
- Tucson: 4.73 inches
- Phoenix: 0.15 of an inch
As a whole, the deviation from the norm for Tucson is not that negative.
A typical season usually produces around 5.7 inches of rain for Tucson’s airport, coming mainly in July and August. This was mirrored in 2023, as the prime months brought 2 and 2.39 inches, respectively, making up for a zero in the June column and a lackluster September
Tucson held close to its 2022 mark as well, coming just 0.20 of an inch from eclipsing that year’s total.
In Flagstaff and Phoenix, things get a lot less pretty.
At the high country’s airport, 2023’s accumulation of 4.24 inches puts it well below its average of 7.68. The year was also dwarfed in comparison to 2022 (10.63 inches) and 2021 (10.90 inches).
In Phoenix, Sky Harbor caught an abysmal 0.15 of an inch of rain this season, easily placing it as the driest on record, pushing out 1924 at 0.35 of an inch. Usually, Sky Harbor gets around 2.43 inches of rain during the season.
When compared even to 2020’s “Nonsoon,” a total that both Tucson and Flagstaff handily exceeded, Phoenix’s 2023 comes nowhere close. Sky Harbor got exactly 1 inch of rain that year, according to NWS statistics.
Overall for Arizona, precipitation in 2023 was more in line with typical seasons than that of 2020 and 2021.
“I would say as far as precipitation patterns, it was more typical because of the variability,” NOAA Warning Coordination Meteorologist Kenneth Drozd told The Arizona Republic. “(In) 2022, there were more places that were above normal than below normal, but it was still pretty mixed. Kind of like this year, there are more places that are below normal than above normal, but it still varies quite a bit depending on where you’re at.”
In 2020 and 2021, Drozd said, conditions were “unique” because of their widespread consistencies, with 2020 being so dry and 2021 being much wetter.
Maricopa County on pace to be wetter than 2020
While Sky Habor couldn’t catch a break, Arizona’s most populous county as a whole is set to end the monsoon season in a better position.
According to data from the Maricopa County Flood Control District, the county posted wetter numbers than it did in 2020, in large part due to healthier amounts falling in Cave Creek, Wickenburg, Apache Junction and portions of the East Valley.
Throughout Maricopa County, totals from data stretching back 108 days from the season’s Saturday endpoint bounce around from lows in central Phoenix at 0.39 of an inch to upward of four inches in parts of Cave Creek.
A notable area that performed the best in the county was near rural Crown King north of the Valley, where there were spots receiving nearly eight inches during the storm span.
“In general, the closer to the mountains you are, the more rain you’re going to receive during monsoon because the storms form over them,” National Weather Service Phoenix office meteorologist Mark O’Malley told The Republic. “That just became exacerbated this year where the areas of south Phoenix through Laveen, down through Avondale and Goodyear, some areas didn’t even receive a tenth of an inch.”
According to O’Malley, the lack of storms this season was primarily due to the weather pattern setting up with strong high pressure over southern Arizona, bringing hotter temperatures and lackluster storms.
“The weather pattern was set up to where it favored the heat and the storms were more removed from the area, more frequently,” O’Malley said.
SRP: 3 monsoons touched down in the Valley in 2023
According to data from Salt River Project, three major monsoon storms hit metro Phoenix in 2023: on July 26, Aug. 31 and Sept. 12.
These storms left their marks, too, with SRP reporting estimated outage numbers at the height of each storm:
- July 26: 50,000 customers out of power
- Aug. 31: 71,000 customers out of power
- Sept. 12: 39,000 customers out of power
APS customers were affected as well, with the company reporting approximate outages during peak storm hours:
- July 26: 7,750 customers without power
- Aug. 31: 18,000 customers without power
- Sept. 12: 11,000 customers without power
Each event brought its own force, bringing down power lines, overturning planes, destroying mobile homes and uprooting trees. While par for the course during the season, rainfall totals certainly weren’t.
The Maricopa County Flood Control District’s point rainfall data paints a clear picture of how dry the year was.
For July 26, chunks of the storm covered the greater Phoenix area into Scottsdale and swaths of the East Valley, with downtown Phoenix only registering 0.04 of an inch of rain. Paradise Valley and Apache Junction received as much as one full inch during the duration of the storm.
On Aug. 31, more portions of Maricopa County got involved but with far less rain. Only two areas throughout the metro saw upward of a half inch. Much of the rain that fell did so in the Cave Creek and New River areas, ranging from 1.45 to 3 inches through the course of the storm.
A storm on Sept. 12 produced the best results for the Valley, with multiple areas getting over the half-inch hump. Again, much of the wealth ended up in Cave Creek, with various areas tabulating over 1.5 inches.
