Solar Is Dirt-Cheap and About to Get Even More Powerful
After focusing for decades on cutting costs, the solar industry is shifting attention to making new advances in technology.
The solar industry has spent decades slashing the cost of generating electricity direct from the sun. Now it’s focusing on making panels even more powerful.
With savings in equipment manufacturing hitting a plateau and more recently pressured by rising prices of raw materials, producers are stepping up work on advances in technology — building better components and employing increasingly sophisticated designs to generate more electricity from the same-sized solar farms.
“The first 20 years in the 21st century saw huge reductions in module prices, but the speed of the reduction started to level off noticeably in the past two years,” said Xiaojing Sun, global solar research leader at Wood Mackenzie Ltd. “Fortunately, new technologies will create further cost-of-electricity reductions.”
Solar Slide
Photovoltaic panel cost declines have slowed in recent years
Source: PVinsights
A push for more powerful solar equipment underscores how further cost reductions remain essential to advance the shift away from fossil fuels. While grid-sized solar farms are now typically cheaper than even the most advanced coal or gas-fired plants, additional savings will be required to pair clean energy sources with the expensive storage technology that’s needed for around-the-clock carbon-free power.
High levels of cancer-causing chemical found in parts of Houston -report
Erwin Seba
FILE PHOTO: The Houston Ship Channel and adjacent refineries, part of the Port of Houston, are seen in Houston.
HOUSTON (Reuters) -High levels of a cancer-causing chemical have been detected in air monitors in Houston neighborhoods near the busiest U.S. petrochemical port, according to a report issued on Thursday by Houston health officials and environmental groups.
The report https://bit.ly/3hqafvk by the Houston Health Department and One Breath Partnership said concentrations of formaldehyde were found at levels 13 times the U.S. Environmental Protection Agency’s minimum level for health threats.
It recommended regulations for plants and control of chemicals contributing to formaldehyde formation be tightened. Formaldehyde levels appear to be increasing in Houston as the Texas Commission on Environmental Quality’s air monitoring sampling frequency is decreasing, the report said.
Houston Mayor Sylvester Turner said the report is further proof of the impact of pollution on “high-poverty communities of color.” (Reuters photo essay on pollution in Houston) https://reut.rs/3hqazdw
“The Texas Commission on Environmental Quality has the responsibility to take immediate action to strengthen existing rules to address the formaldehyde problem plaguing families near the Houston Ship Channel,” Turner said.
Formaldehyde or chemicals that combine to form it are released by refineries, chemical plants and automobiles.
The Houston Health Department between September 2019 and September 2020 tested an area along the Houston Ship Channel that is home to several petrochemical plants and five crude oil refineries.
The highest concentrations of formaldehyde found “would translate to about one additional cancer case per 77,000 people, according to the Houston Health Department’s assessment of EPA’s cancer risk formulas,” the report said.
The report identified plants operated by Exxon Mobil, Chevron, Koch Industries’ Flint Hills Resources and NRG Energy as sources for formaldehyde or the chemicals that combine to form it.
“We are committed to operate in a manner that safeguards our environment and protects our people and community,” said Exxon spokeswoman Julie King. “Exxon Mobil has invested billions on environmental performance measures at our U.S. manufacturing sites over the past 20 years.”
(Reporting by Erwin Seba; Editing by David Gregorio and Lisa Shumamker)
Track The Brutal 2021 Wildfire Season With These Updating Charts And Maps
Peter Aldhous
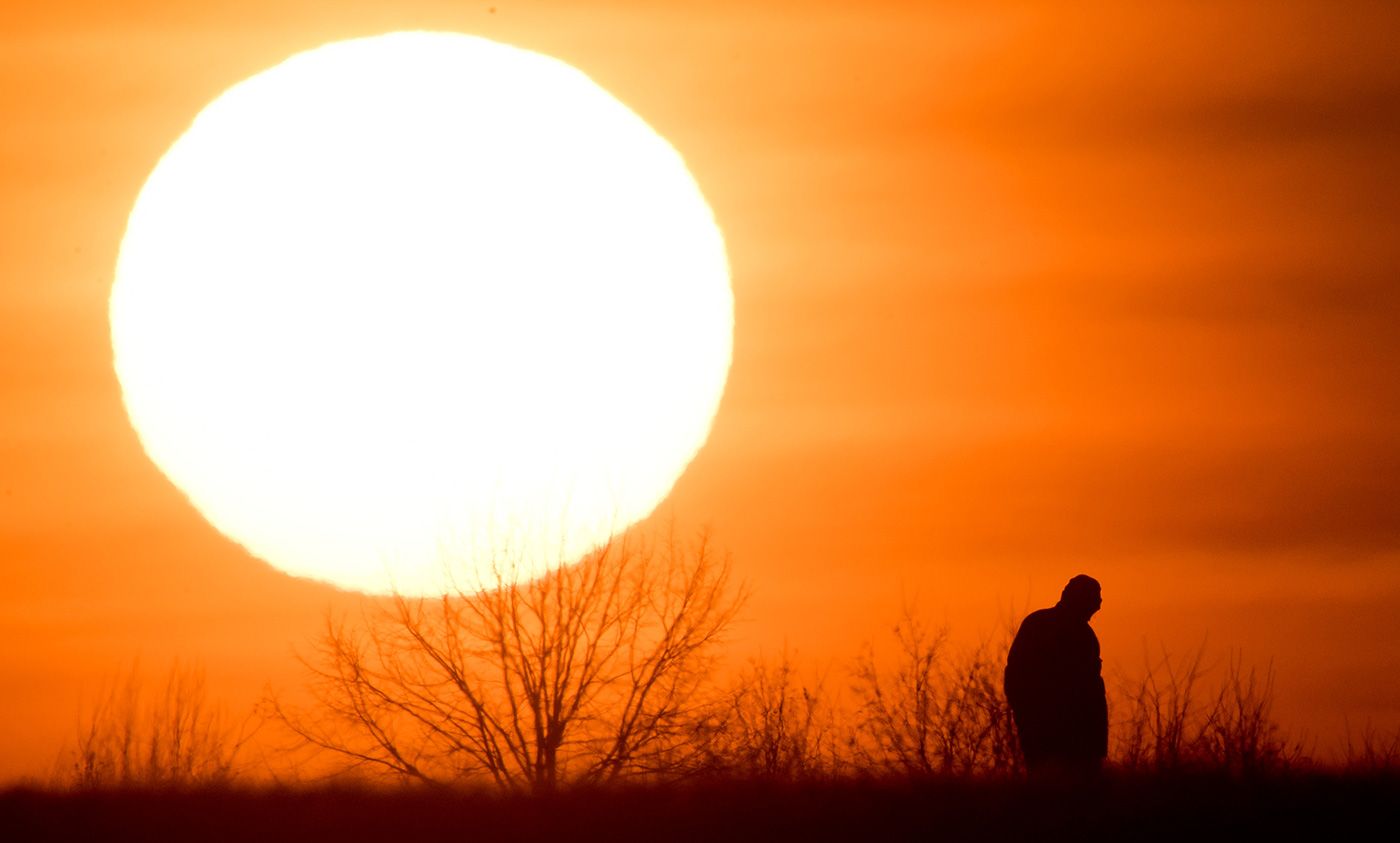
The West is a tinderbox this year, with heat waves and high winds through summer and fall expected to create the conditions for yet another brutal fire season.
“It’s just scary,” Alexandra Syphard, chief scientist with Vertus Wildfire Insurance Services and an ecologist at San Diego State University, told BuzzFeed News. “We’ve seen these severe fire seasons year after year now. Everybody’s nervous.”
The charts and maps below will update to track current wildfires and air quality, compare the 2021 season to previous years, and monitor the weather conditions that make fires more likely to ignite and spread quickly.
This table displays active fires that have so far burned 50 acres or more, recorded by the National Interagency Fire Center and the California Department of Forestry and Fire Protection, or Cal Fire. You can search for any of the fires in the table in the map below to zoom in on the fire and see the perimeter for the area burned, if that data is available.
Tap or hover over the fire icons to see the name of each fire and the area it has burned so far. The map also shows any large plumes of smoke visible from satellites, recorded by the National Oceanic and Atmospheric Administration’s Hazard Mapping System.
Air quality
Smoke plumes visible from orbiting satellites are often at high altitudes, so they may not affect air quality at ground level. But when wildfire smoke accumulates near the ground, it is hazardous for health.
This map shows the latest “NowCast” Air Quality Index (AQI) readings from permanent monitors in the Environmental Protection Agency’s AirNow network. The monitors detect levels of tiny, hazardous particles called PM2.5, extrapolated over wider areas where sufficient data is available.
These airborne particles, which measure less than 2.5 micrometers across, are the main health concern from wildfire smoke because they penetrate deep into the lungs, enter the bloodstream, and can even affect unborn fetuses, lowering birth weight if pregnant people are exposed to smoke. PM2.5 can also trigger heart attacks, asthma, and other respiratory problems.
PM2.5 starts to affect vulnerable people, including young children and those with respiratory conditions, above an AQI of 100. Anything above 200 is considered “very unhealthy” for everyone, while an AQI of 300 or more is rated “hazardous” for all.
Tap or hover over the circles to see the latest PM2.5 AQI for each monitor. You can also type a city into the search box to zoom in on that area.
One reason experts are so concerned about the 2021 wildfire season is that the West is in the grip of a historic drought. An unusually dry winter left soils and vegetation parched, and mountain snowpacks, which feed the region’s rivers, were well below normal. This map shows the latest assessment from the US Drought Monitor, which is updated each Thursday.
Even against the backdrop of widespread drought, the risk of fires igniting and spreading rapidly depends on local weather conditions. This map shows today’s outlook from the US Forest Service’s Wildland Fire Assessment System, which calculates risk categories from weather forecasts and observations.
You can use the control at top right to view areas currently under “red flag” fire warnings issued by the National Weather Service. These are declared when warm weather, low humidity, and strong winds are forecast to produce a high wildfire danger.
How the 2021 fire season compares to recent years
Chart compares the 2021 season to the previous 10 years up until the same date. Peter Aldhous / BuzzFeed News / Via National Interagency Fire Center
This chart compares the number of fires and total area burned so far in 2021 to the same date in each of the previous 10 years, according to data recorded by the National Interagency Fire Center.
But these numbers don’t tell the whole story. How hazardous wildfires are to people depends on when and where those fires happen. For example, large areas of the sparsely populated Mountain West or Plains states can burn without many homes, businesses, or people’s lives or health being threatened.
Last year showed how quickly circumstances can change. The 2020 season was running below the national average for the decade until mid-August, when “dry lightning” storms ignited a series of massive wildfires across Northern California and Oregon. The resulting disaster burned through entire towns in Oregon and created a pall of smoke that blocked the sun, casting large parts of the region in a sickly orange half-light in September and driving air quality into the hazardous range in some cities. By the end of the year, more than 10,000 buildings had been damaged or destroyed in California alone, and the total area burned nationally, at more than 10 million acres, was the second largest on record.
This chart shows the total acreage burned at the end of each year from 1983 — when federal agencies began tracking using the current reporting system — through to 2020. While the area burned varies widely from year to year, the overall trend is increasing.
Fire ecologists and climate scientists attribute this trend in large part to climate change, which is warming and drying California and other states across the West.
While media commentators sometimes describe recent severe fire seasons as the “new normal,” the truth is that ongoing climate change means things are likely to get worse for the foreseeable future. “We have not reached the peak,” Daniel Swain, a climate scientist at the University of California, Los Angeles, told BuzzFeed News last year. “In fact, no one knows where the peak is.”
But that’s not all. Another weather factor came into play and kicked things up a notch. Dry winds, traveling downslope from the east to west, amplified the heat. These type of winds are commonly known to southern Californians as “Santa Ana winds,” but have different names in different places. Generally, the winds travel down from higher elevations (like mountains in eastern Oregon) and the sinking air compresses, creating even more heat in lower areas, like Portland. (This is also called “compressional heating.”)
“It’s the perfect storm.”Those hot winds have amplified what already was an exceptional heat event, explained Weber. Many cooler coastal areas weren’t even spared.
“It’s the perfect storm,” said Weber.
The resulting temperatures are unparalleled in recorded history in the Pacific Northwest. Many people, and buildings, are ill-prepared for this kind of heat. Seattle, for example, is the least air-conditioned metro area in the U.S., according to The Seattle Times.
“It’s hitting an area where people don’t have AC,” noted Weber. “The discomfort level for the population is just overwhelming.” Indeed, illnesses from heat spiked in the Portland region during the extreme weather. Heat illness is serious: Among weather events in the U.S., extreme heat waves kill the most people.
Few heat waves are as anomalous as this Pacific Northwest heat event. As noted above, strong meteorological and climatic events came together at June’s end. But, overall, today’s heat or high temperature records now dominate cold or lower records as the globe warms. For example, twice as many daily heat records are set as cold records.
UPDATE: June 29, 2021, 9:46 a.m. EDT: This story was updated to reflect that Portland smashed its previous heat record of 112 F (set on Sunday) by reaching 116 F on Monday. The story also added that Canada smashed its all-time national heat record, and may do so again on Tuesday.
How Scientists Are So Confident They Know What’s Causing This Insane Weather
Mike Pearl
Nathan Howard/Getty
Dale Durran just endured a historic heatwave in Seattle, and perhaps more than most residents, he’s got good reason to be confident climate change had something to do with the regional madness that proved especially extreme next door, in Oregon, where dozens died.
The professor of atmospheric sciences at the University of Washington told The Daily Beast that this past week’s monstrous stretch—which topped out at a blistering 108 degrees on Monday—was “so outside the range of previous hot spells in Seattle that it really stretches the credibility of anyone suggesting it is simply natural variability.”
Durran isn’t someone who blames climate change every time he breaks a sweat. But he does think about this issue: of accurately attributing seemingly insane weather events, like an entire village being on fire in Canada this past week, to a heating planet.
Last year, in his jargon-heavy paper “Can the Issuance of Hazardous-Weather Warnings Inform the Attribution of Extreme Events to Climate Change?” Durran closely examined something called the “probability of detection” and the “false alarm ratio.”
“The point of this article,” he explained, “is that demanding scientific certainty in the face of an event such as our recent record-crushing heatwave in the Pacific Northwest before accepting the need to take action to stem global warming is as ridiculous as demanding 100 percent certainty before issuing a tornado forecast.”
He’s not alone in thinking the doubters have run out of room—that events have overtaken any shred of sane skepticism.
According to legendary Princeton geoscientist Michael Oppenheimer, scientists are no longer guessing when it comes to tying extreme events like this to climate change, because a whole new field now exists that aims to tie a nice neat bow around these very questions.
“There is now a well developed science of ‘event attribution’ which deals with uncertainty,” Oppenheimer told The Daily Beast. (His own research over the years has focused on what the specific hazards of climate change will be, not necessarily event attribution.)
Here’s Oppenheimer’s explanation of how event attribution scientists do their jobs: They use Fractional Attribution of Risk (FAR), which he said is “the fraction of the intensity of an event (like a heatwave) that can be attributed to human-made greenhouse gases.” For example, event attribution scientists calculated the FAR on 2017’s Hurricane Harvey—after the fact—and it had, Oppenheimer explained, about two times what would have been the case without the greenhouse gases at 2017 levels. That gave Harvey a FAR score of 0.5.
Got all that?
It doesn’t really matter right now, because, according to event attribution specialist Emily Williams—currently still a Ph.D. student in geography at UC Santa Barbara—there’s no FAR score for what just happened to the West Coast. “Until a formal attribution study is done on this current heatwave,” Williams, who co-authored her university’s fact sheet on heatwaves and climate change, told The Daily Beast, “we won’t be able to say specifically how much more intense or likely climate change made it.”
However, Williams said, it’s nonetheless a “pretty safe bet to venture out and say that climate change likely at least exacerbated” the situation.
That’s because what scientists call the overall “probability distribution” of heatwaves has now shifted. So even though they haven’t looked backward at this latest event (or series of events) and tied it to climate change, enough science has been done to safely say the reverse—they more or less predicted this heatwave would happen. What those past scientists have already demonstrated, according to Williams, is that we’re now twice as likely to experience record breaking temperatures, that 16 percent of North America is now exposed to extreme heatwaves, and that when heatwaves arrive, “they’re now hotter.”
Matthew Hurteau, biology researcher at the University of New Mexico, studies the interaction between human behavior and the climate system, with an emphasis on fires—like the one that just consumed an entire Canadian town that had just set a national heat record of 121 degrees. Hurteau conducts his research by looking at reality, and a model of an unchanged climate.
“When I look at the climate change fingerprint on fire in my own research, it typically involves running simulations with and without the climate changing,” he told the Daily Beast.
But he doesn’t always need a model to be certain in his own mind that climate change is to blame when he sees a fire. “When the Creek Fire was burning in the Sierra Nevada last fall and I was looking at the energy release data from satellites and how long into the year it was actively burning,” he said, “it was clear that there was a climate change amplification of that fire.”
Still, it’s worth noting that some scientists find this comparison-to-an-unchanged-world methodology unsatisfying. Not because they believe recent extreme events should be regarded as normal, but simply because we live in the aforementioned changed world, and the other one is fake.
Matthew Igel, an atmospheric scientist focused on clouds at the University of California Davis, told The Daily Beast that now that we’ve filled our atmosphere with greenhouse gases, “We will always lack a realization of Earth without climate change regardless of how excellent our models are or become.”
According to Igel’s explanation, you can think of each attribution study almost as a science-fiction story about someplace called “Earth 2,” where anthropogenic climate change didn’t occur—perhaps because humans don’t exist there. And it’s only by creating a model of Earth 2 that we can understand why it’s so hot here on Earth 1, a.k.a. the only Earth that actually exists. “Our statistical knowledge of truly extreme events from some baseline climate will always be poor,” Igel said. “And regardless, just because we have never observed something before, doesn’t mean that it was impossible, only that it didn’t happen.”
By no means did Igel dismiss the usefulness of attribution science—he’s just hesitant to call it conclusive. “These are the questions that keep me up at night,” he explained.
But the attribution scientists can offer about the connection between climate change, and, for instance, your house being burned down in a wildfire, is good enough to be used in court. At least according to Michael Burger, Columbia Law professor, and executive director at the Sabin Center for Climate Change Law, which cooks up legal techniques to be used in the fight against climate change.
“There is nothing new about courts, or policymakers, making decisions in the face of probability calculations and varying degrees of scientific uncertainty. That’s the nature of the beast,” Burger explained. “As a lawyer, you have to deploy the science to make your case, and fit it to the relevant standard for the particular legal issue you are addressing.”
“Attribution Science has improved the precision of climate data with respect to delineation of atmospheric conditions with and without human caused greenhouse gases,” added Lindene Patton, a lawyer at the legal and advisory company Earth and Water Law Group.
When it comes to expert commentary before a judge, she said, “The state of the art attribution science is good enough—as good as morbidity data or demographic or other data we use.”
So the evidence—as in courtroom evidence—for climate change being the culprit in this heatwave, isn’t in quite yet. But that doesn’t mean the case against the defendant, anthropogenic climate change, isn’t looking extremely strong.
“Climate change caused by high levels of greenhouse gas changes all such events to some degree,” Oppenheimer said, “and I wait to see what the scientists who do these calculations say before deciding specifically how the character of an event was affected by the greenhouse gas buildup. That is precisely what I am waiting for now with regard to the recent heatwave in the Pacific Northwest.”
However, Oppenheimer added, “some events are so off the chart that you can say right off that there was very likely a big greenhouse gas contribution.” Hurricane Harvey, he said, was one of these instances where he didn’t need to wait for the evidence to be pretty sure. “There was no precedent even close to it in the local historical record. I think the same is true for the recent Pacific Northwest event.”
According to Williams, the UC Santa Barbara attribution specialist, events like this are “both a window into the future, and a reminder of why it’s so important that we take action now to transition to a just, low-carbon economy.”
Such a “just, low-carbon economy,” is still a long way off, and those who would stand on the sidelines poking holes in scientific conclusions have helped slow down its creation. According to Durran, we need to stop letting that happen, even if attribution science gets it wrong from time to time.
“Some errors will always occur both when issuing weather warnings and when distinguishing natural variability from human-induced climate change,” he said. “In neither case can we let the possibility of error completely paralyze our response.”
Twelve states including Arkansas, Nevada, and Missouri are now at “high risk” from COVID-19, according to Covid Act Now’s US COVID risk and vaccine tracker, which mostly uses Centers for Disease Control and Prevention (CDC) data. There are just two states at low risk from COVID-19 – Massachusetts and Vermont.
The 12 states at high risk from COVID-19, according to Covid Act Now, are: Nevada, Utah, Missouri, Wyoming, Nebraska, Kansas, Oklahoma, Arkansas, Mississippi, Louisiana, Florida, and South Carolina.
Covid Act Now’s risk calculations are based on six factors that include infection rates, the percentage of people vaccinated, capacity at intensive care units, and socio-economic vulnerabilities that may impact recovery. There are five levels of risk: severe risk, very-high risk, high risk, medium risk and low risk.
Professor Eric Topol, director at the Scripps Research Translational Institute, said on Twitter on Friday that states had moved up risk categories as the Delta variant continued to spread, citing Covid Act Now. He said Delta accounted for at least 35% of new cases in these high-risk states.
By comparison, the Delta variant accounts for more than 80% of new cases in Arkansas, Nevada, and Missouri, according to Outbreak.info. The number of people fully vaccinated is 34% in Arkansas, 42% in Nevada, and 39% in Missouri.
Actual figures may vary because there can be delays in uploading data, or it may not be available. Insider’s Aria Bendix reported on Friday that the CDC stopped monitoring non-severe COVID-19 cases among vaccinated people in May. The number of tests sequenced also differs. For example, the data from Massachusetts is based on more than 18,000 sequenced tests, and Arkansas’ data comes from just over 960 sequenced tests, according to Outbreak.info.
It’s not clear how the level of risk will translate to new infections.
Topol said it was promising that the number of new daily cases was still low. “But rising,” he added.
The hardest question about the Florida condo collapse: Is it worth rebuilding in a city that could be underwater in 30 years?
The hardest question about the Florida condo collapse: Is it worth rebuilding in a city that could be underwater in 30 years?
Tyler Sonnemaker
Developers continue to build in places like Fisher Island, located south of Surfside and Miami Beach, despite the growing risks posed by climate change. Jeffrey Greenberg/Getty Images
The cause of the Florida condo collapse is still unknown, but climate change is among early theories.
Experts say rising sea levels will pose major risks for other coastal residents in the near future.
Yet Miami real estate prices are soaring, even as some experts warn against new development.
A week after the Champlain Towers South condo building in Surfside, near Miami, Florida, collapsed, 22 are dead and more than 100 are still missing.
While speculation is already swirling about what caused the collapse, with observers blaming everything from inaction by the condo board to lax building regulations to rising sea levels, investigators are likely still months from a definitive answer.
One thing is certain, however: Climate change is already threatening to leave substantial parts of coastal areas like Miami underwater in the coming decades, meaning more buildings and infrastructure could be wiped out.
Despite the ominous signs, Miami real estate prices continue to soar and new development projects move forward, in what some experts say is a detachment from the environmental – and economic – reality.
In Florida alone, $26.3 billion worth of coastal property, housing more than 90,000 people, is at risk of becoming “chronically inundated” – that is, flooding at least 26 times per year – by 2045, according to Insider’s analysis of a 2018 report by the Union of Concerned Scientists.
By those estimates, homebuyers taking out a 30-year mortgage today would likely see their homes flooding every two weeks by the time their loan term expires.
“Florida is ground zero for sea level rise in the United States,” Kristy Dahl, a senior climate scientist at UCS, told Insider.
That rise is causing more of the state to experience flooding, not just during so-called “king tides,” but also during normal high tides, Dahl said, adding that “seawater that’s flooding communities is incredibly corrosive.”
“Regular high-tide flooding will affect all kinds of infrastructure in the coming decades,” she said, pointing out a UCS study that showed how flooding could derail Amtrak’s Northeast Corridor route by 2050.
“A way to drive our economy”
After Hurricane Andrew devastated the state in 1992, Florida passed a wave of new building codes to mitigate future storm damage. The Palm Beach Post reported Friday that the collapse in Surfside could similarly push lawmakers to abandon the state’s historically hands-off approach to regulation in favor of more stringent rules for aging condo buildings.
Following decades of denialism, more Florida Republicans have also begun to acknowledge the reality of climate change and the risks it poses for their coastal communities, paving the way for more aggressive, bipartisan efforts.
Florida’s state legislature recently authorized $640 million for climate resiliency initiatives, while the mayors of Miami, Miami Beach, and Miami-Dade County have rolled out a strategic plan outlining steps to prepare the region.
Some developers are also beginning to see a business case for investing in climate resilience.
“We need to understand about how much it’s going to cost, but ultimately… we found that the return on investment is significant and it will create thousands of jobs,” Alec Bogdanoff, CEO of Brizaga, a Florida-based civil and coastal engineering firm, told Insider.
“We’re not only investing in adaptation and resilience because we have to, but it’s actually a way to drive our economy and grow our economy,” he said.
But some experts worry that trying to adapt to the climate – through evolving construction techniques, pump systems, and raised buildings and sidewalks, for example – may still not be enough to save cities like Miami.
“Why the heck are we letting people build?”
“We know seawater is going to arrive,” Harold Wanless, a professor and chair of the department of geological science at the University of Miami, told Insider. “What we should be doing is saying: ‘Why the heck are we letting people build in an area that’s going to be flooded by rising sea levels?”
Wanless said that a 2-3 foot rise in sea level, which estimates predict could happen in Miami by 2060, would also cause 100 to 200 feet of beach erosion, a rate that would make it too expensive to combat by simply adding more sand.
“At that point, you don’t fight it, and we should be realizing that’s where we’re headed,” Wanless said.
But many still don’t, partly because various financial incentives keep pushing developers to build in high-risk areas, including their outsize influence over local politics and wealthy buyers’ ability to withstand losses, according to a report last year in Yale’s Environment360.
That report argues that the “narrow path for survival” for Florida’s coastal counties involves, among other strategies, “orderly retreats from most vulnerable coastal neighborhoods.”
But withdrawing from coastal properties, despite the science, would run up against another obstacle, according to Dahl: human nature.
“We’re still drawn to the water just as we always have been, and I think that’s going to be a really difficult cultural shift to make,” she said, especially given the lack of disclosure about climate risks in real estate listings.
In 2019, journalist Sarah Miller pretended to be interested in buying a luxury home in Miami Beach so she could ask realtors about climate-related risks, detailing the “cognitive dissonance” she witnessed in an article for Popula.
In response to a friend’s skepticism about whether cities could become climate-proof through resilience alone, Miller wrote: “This is the neoliberal notion, that the reasonable and mature way to think about this stuff is: Get more efficient and find the right incentives to encourage the right kinds of enterprise. But my friend wondered, what if the mature thing to do is to mourn – and then retreat?”
Former Fox Exec Calls Network ‘Poison For America’ In Blistering Rebuke
By Josephine Harvey July 5, 2021
Rupert Murdoch “owes himself a better legacy than a news channel that no reasonable person would believe,” Preston Padden wrote.
A former top Fox Broadcasting executive has voiced a searing condemnation of Fox News, calling it “poison for America” and saying even the network’s owner, Rupert Murdoch, doesn’t believe its coverage.
“Rupert Murdoch, whom I served for seven years, has many business and journalistic achievements. He owes himself a better legacy than a news channel that no reasonable person would believe,” wrote Preston Padden in an op-ed for The Daily Beast.
Padden served as president of network distribution at the Fox Broadcasting Company in the 1990s and played a role in the launch of Fox News, which was started with a goal to fill “an opening for a responsible and truthful center-right news network,” he said.
But in recent years, he continued, things have gone “badly off the tracks at Fox News.”
He accused the channel, particularly its prime-time opinion programming, of making a substantial and direct contribution to: COVID-19 deaths via vaccine and mask misinformation; societal divisions by stoking racial animus and spreading falsehoods about Black Lives Matter protests; former President Donald Trump’s “Big Lie” about the 2020 election; and the violent Jan. 6 attack on the U.S. Capitol led by his supporters.
“Fox News has caused many millions of Americans — most of them Republicans (as my wife and I were for 50 years) — to believe things that simply are not true,” he wrote.
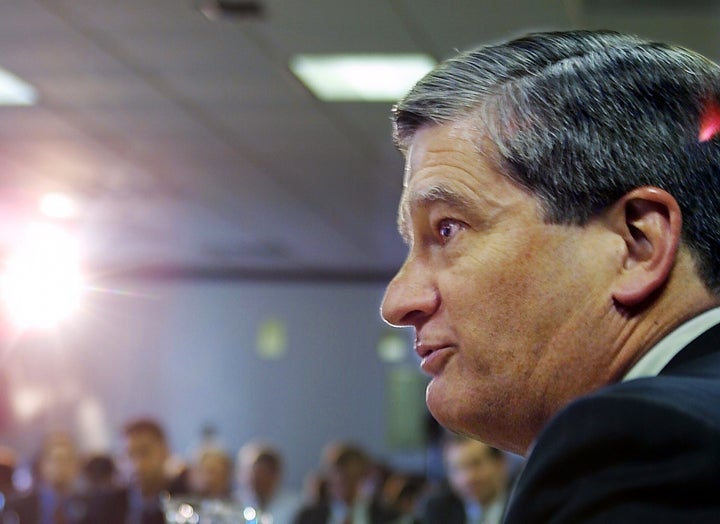
MANNY CENETA VIA GETTY IMAGES, 2001.
Preston Padden has been in the media industry for more than two decades. In that time, he’s served as an executive at Fox Broadcasting, ABC, the Walt Disney Company, among other organizations.
He referred to polling that indicates a significant portion of Republicans blame “left-wing protesters” for the Jan. 6 attack. “Of course, that is ludicrous,” he wrote. He also pointed to statistics that suggested two-thirds of Republicans believe or suspect the 2020 election was stolen from Trump.
“This ridiculous notion has been thoroughly refuted,” Padden continued. “But millions of Americans believe these falsehoods because they have been drilled into their minds, night after night, by Fox News.”
He said the “greatest irony” lay in his belief that most of the falsehoods on Fox News did not reflect Murdoch’s own views. He added:
I believe that he thought that it was important to protect his own health by wearing a mask during the pandemic and he encouraged me to do the same. I believe that he thought that it was important to protect his own health by getting vaccinated at the earliest opportunity and he encouraged me to do the same. And I believe that he thinks that former President Trump is an egomaniac who lost the election by turning off voters, especially suburban women, with his behavior.
Padden, who currently serves as the principle of a consulting business and as an advisory board member for a private equity investment firm, said he had tried and failed over the past nine months to make Murdoch understand the damage Fox News is doing to America.
“I am at a loss to understand why he will not change course,” he said.
Fox News did not immediately respond to HuffPost’s request for comment.
The electorate is shifting — and not in the Republican Party’s favor
David Faris July 6, 2021
Illustrated | Getty Images, iStock
A new deep dive into the 2020 electorate by Pew Research contains mostly bad news for Republicans, whose approaching demographic doom is less racial than it is generational. While it shouldn’t be news to anyone at this point that young voters are a solidly blue voting bloc, the more worrisome developments for the GOP are the unexpectedly elderly nature of the party’s coalition and the unyielding Democratic lean of younger voters as they age. If Pew’s numbers are to be believed, the only solidly Republican age demographic last year was 75 and over, meaning that every time the sun comes up, the GOP’s struggle to win a majority of American voters gets harder.
Pew’s in-depth study uses validated voter files – matching panelists to a registration database confirming whether or not they turned out – to offer a different, and possibly more accurate, view of the electorate than the exit polls taken on Election Day. Often this new data can challenge narratives that set in stubbornly and immediately after the votes are counted – in 2016, for example, Pew’s research found that Donald Trump won white women by a considerably smaller margin than Election Day surveys indicated, upending one prevailing story about who was most responsible for Hillary Clinton’s stunning loss.
There were some important differences between exit polls and the new study. For example, Pew found that Trump did better with Latino voters, and worse with Black voters, than exit polls indicated. Still, both sets of numbers showed Trump making modest inroads with these groups, easily the most concerning development for Democrats because of their centrality to the party’s coalition. Exit polls had Trump winning married men by 11 points, while Pew gave this group to Biden by 5. Trump, seemingly paradoxically, lost ground with men and gained some with women, narrowing the overall gender gap. It’s pretty difficult to discern a pattern in these differences, and the truth probably lies somewhere in the middle.
But then there are the age numbers. Biden, predictably, obliterated Trump with the youngest voters – members of the so-called Generation Z, born after 1996, as well as younger millennials. Exit polls had Biden winning 18- to 29-year-olds by 24 points, 60-36, whereas Pew pegs it at 58-38. Exit polls also showed Trump with just a 52-47 edge among voters over 65, and Pew’s numbers came in almost identical – 52-48 for Trump over Biden. And if those were the only topline stats you saw, you wouldn’t think there was a huge problem for Republicans.
But Pew also broke the survey down into not just age groups but generational cohorts. And it’s here where you’ll find the most terrifying information for the GOP. According to Pew, Trump won a decisive majority only with members of the “Silent Generation,” those born between 1928 and 1945 (and the extremely tiny number of living people older than that). Trump dominated that cohort by 16 points, 58-42. That means that the only reliably Republican voter bloc will shrink considerably between now and 2024, and that 65- to 74-year-olds must have been a much more blue-leaning group in 2020 to produce Trump’s comparatively narrow 4-point margin with all over-65s.
You don’t need a degree in actuarial science to know that in general, 65- to 74-year-olds will be around considerably longer than 75- to 102-year-olds. According to the Social Security Administration, a 65-year-old man has a remaining life expectancy of almost 18 years. At 75, it’s just over 11 years, and at 85 it’s less than six. Members of the Silent Generation are expected to shrink from 9 percent of the voting eligible population in 2020 to 7 percent in 2024. And while I hope that my over-75 parents are around as long as humanly possible, if I were a GOP operative I would be apoplectically trying to figure out ways to make the age profile of the average party supporter substantially younger, rather than tripling down on whatever Fox-driven cultural hysteria is dominating headlines in the conservative media. This stuff is not resonating with anyone who has more than 30 years to live.
Perhaps even worse for former President Trump and his acolytes, the Pew data showed little erosion in the millennial preference for Democrats over Republicans. Fifty-six percent of millennials voted for Clinton in 2016, and 58 percent voted for Biden in 2020. Remember, the first millennials voted in 2002, and as a group they simply have not budged. “Elder millennials” are turning 40 this year and they don’t love the Republican Party any more than they did when George W. Bush was lighting several trillion dollars on fire prosecuting a pointless war in Iraq. And that’s terrible news for the GOP’s hopes of ever becoming a majority party again, because if they keep losing the youngest voters by double digits election after election, they need a significant number of them to get more conservative as they age just to hold current margins in place.
That doesn’t mean Democrats are guaranteed to win the next several elections, even if the playing field is fair. “Demography is destiny” as a theory has aged badly, largely because Republicans remain competitive at the national level even as the country becomes more diverse and less white. Trump’s gains among Latino voters helped avert a total bloodbath in 2020, and there is no particular reason why Republicans couldn’t do better with them in 2024, in theory.
After all, Democrats’ deteriorating performance with non-college educated white voters over the past decade offset the ongoing diversification of the electorate. But according to Pew, the rightward march of white voters was halted and marginally reversed by Joe Biden in 2020, who did 4 points better with non-college-educated whites than Clinton. Republicans may have already run headlong into a white ceiling.
Republicans also continue to make up zero ground with young people. This year’s Harvard Youth Poll of 18- to 29-year-olds was the same horror show for the GOP that it has been for years, and it included yet another year of newly eligible voters who are repulsed by the dyspeptic, off-putting spectacle of the modern Republican Party, whose leading thinkers and politicians are staking their 2022 election strategy on a Woke Panic gambit dependent on demonizing an obscure academic concept (Critical Race Theory) and convincing voters that their imminent (and completely imagined) “cancellation” is their most important problem.
Thirty percent of Americans under 29 think Donald Trump was the worst president in American history. Sixty-five percent have an unfavorable view of the former president. Just 18 percent watch Fox News, the primary national vector for viral paranoia and disinformation, regularly. The Pew report is just a brutal document for Republicans. And it suggests that the light at the end of the tunnel, far from illuminating a path out of the wilderness for the GOP, is instead an oncoming, hostile generation poised to put Republicans at a decisive disadvantage in national elections for years.
“It’s a full partnership,” the 39th president told The Associated Press during a joint interview ahead of the couple’s 75th wedding anniversary on July 7.
It will be another milestone for the longest-married presidential couple in American history. At 96, Carter also is the longest-lived of the 45 men who’ve served as chief executive. Yet even having reached that pinnacle, Carter has said often since leaving the Oval Office in 1981 that the most important decision he ever made wasn’t as head of state, commander in chief or even executive officer of a nuclear submarine in the early years of the Cold War.
Rather, it was falling for Eleanor Rosalynn Smith in 1945 and marrying her the following summer. “My biggest secret is to marry the right person if you want to have a long-lasting marriage,” Carter said.
The nonagenarians — she’s now 93 — offered a few other tips for an enduring bond.
“Every day there needs to be reconciliation and communication between the two spouses,” the former president said, explaining that he and Rosalynn, both devout Christians, read the Bible together aloud each night — something they’ve done for years, even when separated by their travels. “We don’t go to sleep with some remaining differences between us,” he said.
Rosalynn Carter noted the importance of finding common interests. Even now, she said, “Jimmy and I are always looking for things to do together.” Still, she emphasized a caveat: “Each (person) should have some space. That’s really important.”
As first lady, Rosalynn Carter carved her own identity even as she supported her husband. Building on her predecessors’ efforts to highlight special causes, she went to work in her own East Wing office, setting a standard for first ladies by working alongside her husband’s West Wing aides on key legislation, especially dealing with health care and mental health. She continued that focus as the couple built the Carter Center in Atlanta after their White House years.
Certainly, a 75-year marriage hasn’t been seamless, the couple acknowledges.
Jimmy was initially on course to be an admiral, not commander in chief, and Rosalynn appreciated their life beyond Plains, home to fewer than a thousand people, then and now. But when James Earl Carter Sr. became sick and died in 1953, his son cut short his Navy
career and decided the family would return to rural Georgia.
The former president has written that in retrospect he finds it inconceivable not to discuss such a life-changing decision with his wife, who was unhappy with the move. Now, they see the blossoming of their partnership in that challenging juncture.
“We developed a partnership when we were working in the farm supply business, and it continued when Jimmy got involved in politics,” Rosalynn Carter told AP. “I knew more on paper about the business than he did. He would take my advice about things,” she added, drawing a laugh and affirmation from her husband.
Jimmy Carter also didn’t seek Rosalynn’s permission to make his first bid for office a few years later. In that instance, she was on board anyway.
“My wife is much more political,” he said.
She interjected: “I love it. I love campaigning. I had the best time. I was in all the states in the United States. I campaigned solid every day the last time we ran.”
That didn’t help avoid a rout by Republican Ronald Reagan in 1980. But it further cemented Rosalynn — who’d originally given up her own opportunity to go to college when she married at age 18 — as equal partner to the leader of the free world. And it marked Jimmy Carter’s evolution as a spouse.
He’s since been an outspoken voice for women’s rights, including within Christianity. Carter left the Southern Baptist Convention in 2006, denouncing what he called “rigid” views that “subjugated” women in the church and in their own marriages.
The former president ratified those views again, as well as his support for the church recognizing same-sex marriage. “It will continue to be divisive,” he said. “But the church is evolving.”
The Carters plan to celebrate their own marriage milestone a few days after their anniversary with a party in Plains. Decades removed from inaugural balls and state dinners, the most famous residents of Sumter County said they have mixed feelings about the spotlight.
“We have too many people invited,” Rosalynn Carter said with a laugh. “I’m actually praying for some turndowns and regrets.”