
There's a buzz around Stockholm. Read more: http://bit.ly/2uCOU7C
Posted by EcoWatch on Thursday, August 10, 2017
Category: Health – Happiness
America’s wind energy industry passed a major milestone
ThinkProgress
America’s wind energy industry passed a major milestone
Economic challenges facing wind energy are nothing new, industry says.
Mark Hand August 9, 2017
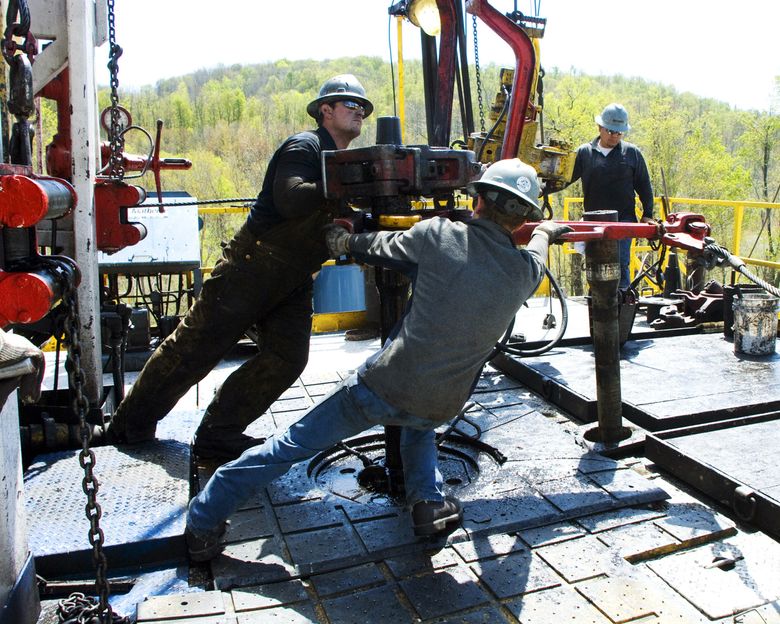
 The Dry Lake Wind Power Project in Arizona. CREDIT: Department of Energy
The wind energy industry reached an important milestone in 2016 when it passed the generating capacity of hydroelectric power for the first time to become the nation’s top renewable generating source. Wind energy’s growth — at least in the next few years — is showing few signs of slowing down, with 142,000 megawatts of new and proposed wind capacity lined up to connect to the nation’s electric power grid, according to new data released by the Department of Energy.
The total amount of wind capacity in the queue represents 34 percent of all generating capacity waiting to connect to the grid, higher than all other generating sources, DOE said. The wind energy industry added more than 8,200 megawatts of capacity in 2016, representing 27 percent of all energy capacity additions for that year.
That annual growth lifted the nation’s wind capacity to 81,312 megawatts at the end of December 2016, slightly above hydroelectric’s 79,985 megawatts of capacity, according to DOE. Wind supplied about 6 percent of U.S. electricity, and 14 states now get more than 10 percent of their electricity from wind.
DOE released three wind market reports on Tuesday, covering wind technology, offshore wind, and distributed wind. The primary authors of the wind technology report were employees at DOE’s Lawrence Berkeley National Laboratory. The offshore wind report was prepared by employees at DOE’s National Renewable Energy Laboratory. Employees at DOE’s Pacific Northwest National Laboratory prepared the distributed wind report.
“The wind industry continues to install significant amounts of new capacity, and supplied about 6 percent of total U.S. electricity in 2016,” Daniel Simmons, DOE acting assistant secretary for energy efficiency and renewable energy, said in a statement. “As our reports explain, a combination of federal subsidies, state mandates, and technological advancements continue to help drive new wind capacity additions.”
Prior to joining DOE, Simmons worked at the Koch-funded Institute for Energy Research as vice president for policy and also held a top position at the Koch-funded American Energy Alliance, which advocated for the office he now oversees at DOE — the Office of Energy Efficiency and Renewable Energy — to be eliminated.
Wind turbine prices remained well below levels seen a decade ago, DOE said. After hitting a low of roughly $800 per kilowatt from 2000 to 2002, average turbine prices increased to roughly $1,600 per kilowatt by the end of 2008. Over the past decade, though, wind turbine prices have dropped substantially.
Technological innovations are helping wind turbines optimize their performance by reaching stronger, steadier winds, according to the American Wind Energy Association, the primary trade association for the wind power industry. Longer blades have helped to boost new wind turbine performance, with wind projects built in 2014 and 2015 reporting a 42.5 percent average capacity factor in 2016, compared to a 32.1 percent capacity factor for projects built between 2004 and 2011, AWEA said in press release Wednesday.
In the offshore report, DOE noted that more than 20 offshore wind projects totaling 24,135 megawatts of potential installed capacity are in the works. The report highlighted that last December, Deepwater Wind completed the commissioning of the Block Island Wind Farm, marking a milestone as the first commercial offshore wind project in the United States.
The first major offshore wind project in the U.S. is now powering an island

Renewable energy continues its march forward.
From 2003 through 2016, a total of 992 megawatts in capacity from more than 77,000 wind turbines was deployed in distributed applications across all 50 states, the District of Columbia, Puerto Rico, the U.S. Virgin Islands, and Guam, DOE said.
DOE said its recent and projected near-term growth in wind energy is supported by the federal production tax credit and state-level policies. Wind additions have also been driven by improvements in the cost and performance of wind power technologies, producing low power prices for consumers.
The prospects for wind energy growth beyond the current PTC cycle remain uncertain, given declining federal tax support, expectations for low natural gas prices, and modest electricity demand growth, DOE said. At the end of 2015, Congress agreed to extend the production tax credit. Since then, wind developers have been building projects before the tax credit expires completely in 2020.
The DOE report lists many positive factors, including the potential for continued technological advancements and cost reductions to enhance the prospects for longer-term growth, Hannah Hunt, a research analyst at AWEA, said in a blog post on Tuesday.
“Some have focused on the report’s discussion of potential economic challenges for the industry, including competition from natural gas and solar,” Hunt wrote. “However, it should be noted that those challenges are nothing new and have in fact been listed in every version of the report this decade. Thanks to the innovation and productivity of American workers, the wind industry has been able overcome those challenges by greatly exceeding cost reduction expectations, and we expect that successful track record to continue.”
Interactive Map Shows Every Wind Farm in America
EcoWatch
Interactive Map Shows Every Wind Farm in America
By American Wind Energy Association August 10, 2017

Using a new map tool released Thursday, anyone can now easily view the location of every utility-scale wind project and wind-related manufacturing facility in the U.S. With the very first American Wind Week in full swing, the American Wind Energy Association (AWEA) released the map to help people visualize the growth of America’s largest source of renewable energy capacity.
“Wind Power has become a vital part of the U.S. economy, drawing billions of dollars in capital investment to rural communities each year and supporting over 100,000 U.S. jobs across all 50 states,” said John Hensley, deputy director of industry data and analysis for AWEA. “I’m pleased this new map tool helps Americans visualize how world-class U.S. wind resources are being put to work in all parts of the county.”
A time-lapse feature built into the map shows the progress of wind power development across the country. Starting from 1981 in the passes of California where the first modern wind energy projects were completed, users can see the story of American wind power unfold across heartland states like Texas, Iowa, Oklahoma and Kansas, and eventually to the first U.S. offshore wind project completed off Rhode Island in 2016.
The map also features markers for the more than 500 wind-related manufacturing facilities in the U.S. today. These factories support 25,000 U.S. manufacturing jobs across 41 states.
AWEA’s new map utilizes only a small percentage of the full wind project and manufacturing data available to AWEA members through Market Database Pro, a comprehensive, interactive database of all online, under construction and advanced development wind projects, and all active wind-related manufacturing facilities. More than 50 data points are provided at both the project and turbine level, with advanced interactive mapping services including filtered search capabilities, summary maps and political boundaries.
This week is the inaugural #AmericanWindWeek, dedicated to U.S. leadership in wind power. Wind is the largest source of American renewable energy capacity, supporting more than 100,000 U.S. jobs across all 50 states, with nearly 85,000 MW of installed capacity at the end of the second quarter of 2017.
Polluter fines drop 60 percent under Trump
Washington Post, Energy and Environment
Polluter fines drop 60 percent under Trump
By Steven Mufson August 10, 2017

The Trump administration has so far collected $12 million in environmental-related penalties from businesses, according to a nonprofit. Above, EPA Administrator Scott Pruitt speaks during an interview for Reuters at his office in July. (Yuri Gripas/Reuters)
The Trump administration has collected 60 percent less from civil penalties for environmental wrongdoing than the administrations of presidents Barack Obama, George W. Bush and Bill Clinton did on average in their first six months in office.
That’s according to an analysis by the Environmental Integrity Project, a nonprofit group founded 15 years ago by former enforcement attorneys at the Environmental Protection Agency.
The administration has lodged 26 cases for violations of the Clean Air Act, Clean Water Act and other environmental laws (not including Superfund sites) and it collected $12 million in penalties from companies, the group said. Clinton, Bush and Obama respectively lodged 45, 31, and 34 cases and collected $25 million, $30 million and $36 million in penalties.
Related: White House reviewing new report that finds strong link between climate change and human activity
The Environmental Integrity Project said that the figures showed that the Trump administration is “off to a very slow start” when it comes to enforcing environmental law. It said that the cases this year “are smaller, requiring much less spending on cleanup, and resulting in fewer measurable reductions in pollutants that end up in our air or water.”
The Trump administration also lags behind the three previous presidential administrations in the amount of injunctive relief and the amount of air pollution reductions.
At the same time, the group warned that a six-month period does not provide enough data for definitive conclusions, and cases and settlements are often the result of years of efforts. For example, the largest civil penalty imposed by the Obama administration in its first six months was a $12 million fine imposed on BP, whose large Texas City refinery suffered fires and explosions that killed 15 people and injured more than 170 others in 2005.
The largest civil penalty imposed so far by the Trump administration came on May 17, when the EPA and the state of Texas imposed a $2.5 million penalty on the owner of Vopak Terminals North America Inc. for air pollution violations at its terminal along the Houston Ship Channel, the EIP said. The Dutch company’s terminal stores biofuels, chemicals, petroleum products, base oils and lubricants, consisting of 243 tanks with a collective capacity of over 7 million barrels, the EPA said on its website.
It added that Vopak’s violations were detected in 2012, 2014 and 2015 involving open tanks, leaking tanks and inefficient flares that contributed to releases of volatile organic compounds.
Related: At EPA museum, history might be in for a change
“The company’s Deer Park facility failed to comply with Clean Air Act requirements to properly manage equipment, which resulted in excess emissions of benzene (a carcinogen) and volatile organic compounds,” the EIP said. “These compounds contribute to smog and causes asthma attacks and eye, nose and throat irritation, as well as headaches, nausea and damage to liver, kidney and the central nervous system.”
The biggest penalty imposed during the first six months of George W. Bush’s administration was a $9.5 million fine on oil refiners Motiva, Equilon and Shell. The Clinton administration imposed a $11.1 million fine on Louisiana Pacific and Kirby Forest Industries for air pollution violations at wood product plants.
The EIP relied on consent decrees, news releases by the Justice Department and the Federal Register to compile its figures.
Read more:
Will proposed cuts undermine Trump’s vision of ‘energy dominance?’
Is the most powerful lobbyist in Washington losing its grip?
Steven Mufson covers energy and other financial matters. Since joining The Post, he has covered the White House, China, economic policy and diplomacy.
Electric vehicles to eat into global oil demand by 6 million barrels
UPI Home-Energy News
Electric vehicles to eat into global oil demand by 6 million barrels
A report from Wood Mackenzie finds the purchase price for electric vehicles is on course to reach parity with their internal-combustion counterparts.
By Daniel J. Graeber August 10, 2017

The pace at which electric vehicles are gaining market share is eating into the expected long-term demand for oil, a new report finds. Photo by Stephen Shaver/UP | License Photo
Aug. 10 (UPI) — An increased consumer use of electric vehicles means global oil demand could shrink by at least 6 million barrels, a report from Wood Mackenzie found.
In what was described as a carbon-constrained scenario, the new report, prepared in coordination with GTM Research, which covers the global electricity sector, said electric vehicles could make up about 20 percent of all of the cars on the road in less than 20 years.
“The falling cost of EVs and their batteries will put EV purchase prices on par with internal combustion engine cars, boosting consumer demand,” Paul McConnell, research director of global trends for Wood Mackenzie, said in an emailed statement.
Swedish automaker Volvo said this year it was marking an end to a vehicle line powered solely by the internal combustion engine. Tesla said in its second quarter release that orders for two of its electric vehicle lines were up 15 percent in July when compared with the quarterly average.
Two million electric vehicles were on the road globally last year, with most of those in the U.S., European and Chinese markets. For Europe, the British and French governments set long-term goals to phase out new gasoline- and diesel-powered vehicles. Germany, meanwhile, has worked quickly to expand its network of charging stations across its national roadway system.
Wood Mackenzie described the maturation of the electric vehicle market as “rapid,” adding it expected momentum to start eating away at the global demand for oil.
“We foresee EVs potentially displacing about 6.5 million barrels of oil demand, offsetting growth from other sectors such as petrochemicals,” McConnell said.
Economists at the Organization of Petroleum Exporting Countries revised their forecast for global oil demand for 2018 higher by 1.28 million barrels per day to 97.7 million barrels per day. Total oil demand for 2017 is expected to be 96.49 million barrels per day. Most of the demand growth next year comes from developing countries.
Using the pace of transition from horse-drawn carriages to fuel-powered vehicles in the 20th century as a benchmark to measure growth, the International Monetary Fund said motor vehicles could vanish from markets in advanced economies within the next 20 years. For the shift in vehicles themselves, the IMF said retooling may be necessary for the industry.
“The falling cost of EVs and their batteries will put EV purchase prices on par with internal combustion engine cars, boosting consumer demand,” McConnell said. “This is going to force automakers to develop even better EVs or far more efficient internal combustion engines, as per-mile running costs become a key differentiator between the new technology and legacy engine types.”
Related UPI Stories
Britain to start taking gas, diesel vehicles off roads in 2040
Study: Trump actions trigger health premium hikes for 2018
Associated Press
Study: Trump actions trigger health premium hikes for 2018
Ricardo Alonso Zaldivar, Associated Press August 10, 2017

WASHINGTON (AP) — The Trump administration’s own actions are triggering double-digit premium increases on individual health insurance policies purchased by many consumers, a nonpartisan study has found.
The analysis released Thursday by the Kaiser Family Foundation found that mixed signals from President Donald Trump have created uncertainty “far outside the norm,” leading insurers to seek higher premium increases for 2018 than would otherwise have been the case.
The report comes with Republicans in Congress unable to deliver on their promise to repeal and replace the Obama-era Affordable Care Act. Trump, meanwhile, insists lawmakers try again. The president says “Obamacare” is collapsing, but he’s also threatened to give it a shove by stopping billions of dollars in payments to insurers. Some leading Republicans are considering fallback measures to stabilize markets.
Researchers from the Kaiser foundation looked at proposed premiums for a benchmark silver plan across major metropolitan areas in 20 states and Washington, D.C. Overall, they found that 15 of those cities will see increases of 10 percent or more next year.
The highest: a 49 percent jump in Wilmington, Delaware. The only decline: a 5 percent reduction in Providence, Rhode Island.
About 10 million people who buy policies through HealthCare.gov and state-run markets are potentially affected, as well as another 5 million to 7 million who purchase individual policies on their own.
Consumers in the government-sponsored markets can dodge the hit with the help of tax credits that most of them qualify for to help pay premiums. But off-marketplace customers pay full freight, and they face a second consecutive year of steep increases. Many are self-employed business owners.
The report also found that insurer participation in the ACA markets will be lower than at any time since “Obamacare” opened for business in 2014. The average: 4.6 insurers in the states studied, down from 5.7 insurers this year. In many cases insurers do not sell plans in every community in a state.
The researchers analyzed publicly available filings through which insurers justify their proposed premiums to state regulators. To be sure, insurers continue to struggle with sicker-than-expected customers and disappointing enrollment. And an ACA tax on the industry is expected to add 2 to 3 percentage points to premiums next year.
But on top of that, the researchers found the mixed signals from the administration account for some of the higher charges. Those could increase before enrollment starts Nov. 1.
“The vast majority of companies in states with detailed rate filings have included some language around the uncertainty, so it is likely that more companies will revise their premiums to reflect uncertainty in the absence of clear answers from Congress or the administration,” the report said. Once premiums are set, they’re generally in place for a whole year.
Insurers who assumed that Trump will make good on his threat to stop billions in payments to subsidize co-pays and deductibles requested additional premium increases ranging from 2 percent to 23 percent, the report found.
Insurers who assumed the IRS under Trump will not enforce unpopular fines on people who remain uninsured requested additional premium increases ranging from 1.2 percent to 20 percent.
“In many cases that means insurers are adding double-digit premium increases on top of what they otherwise would have requested,” said Cynthia Cox, a co-author of the Kaiser report. “In many cases, what we are seeing is an additional increase due to the political uncertainty.”
That doesn’t sound like what Trump promised when he assumed the presidency.
In a Washington Post interview ahead of his inauguration, Trump said, “We’re going to have insurance for everybody.”
“There was a philosophy in some circles that if you can’t pay for it, you don’t get it,” he added. “That’s not going to happen with us.”
People covered under Obama’s law “can expect to have great health care,” Trump said at the time. “It will be in a much simplified form. Much less expensive and much better.”
But the White House never produced the health care proposal Trump promised. And the GOP bills in Congress would have left millions more uninsured, a sobering side-effect that contributed to their political undoing.
The Trump administration sidestepped questions about its own role raised by the Kaiser study.
Spokeswoman Alleigh Marre said rising premiums and dwindling choices predate Trump.
“The Trump administration is committed to repealing and replacing Obamacare and will always be focused on putting patients, families, and doctors, not Washington, in charge of health care,” Marre said in a statement.
The ongoing political turmoil for people who buy individual health insurance stands in sharp contrast to relative calm and stability for the majority of Americans insured through workplace plans. The cost of employer-sponsored coverage is expected to rise around 5 or 6 percent next year, benefits consultants say.
Associated Press Health Writer Tom Murphy in Indianapolis contributed to this report.
Kaiser report – https://tinyurl.com/ya2yneqj
Farmers in Wisconsin and Minnesota are now recycling millions of pounds of plastic
Chicago Tribune
Farmers in Wisconsin and Minnesota are now recycling millions of pounds of plastic
Wrapping hay and silage in plastic is generating millions of pounds of waste per year. (Dreamstime / TNS)
Tom Meersman, Minneapolis Star-Tribune August 9, 2017
Minnesota and Wisconsin farms generate 60 million to 80 million pounds of plastic each year but until now had no real options to recycle it. They had to make a choice of paying for it to go to a landfill, burying it on their own land or illegally burning it — none of them, they knew, good for the environment.
An Arkansas company has come up with a solution: In the past two years, it has given more than 4,400 dumpsters to farmers in the two states and then picked up the waste to turn into trash bags that are being used in parks locally.
“Recycling Ag plastics is a problem that’s bedeviled me for 20 years,” said Anne Morse, recycling and sustainability coordinator for Winona County in southeastern Minnesota. “There wasn’t a system that I could set up that made sense and wasn’t extremely costly.”
That ended last December, when Winona became the first county in the state to welcome Revolution Plastics, the Arkansas-based company that has been in the plastics recycling business in Southern states since 1996.
Revolution, wanting to expand its reach, set up pilot programs in the Midwest in 2014 and 2015 and initiated a full launch in Minnesota and Wisconsin last year, said Price Murphy, the company’s director of operations.
Farmers who use at least 2,000 pounds of plastic a year can sign up for the program, Murphy said. More than 100 dumpsters will be distributed in Fergus Falls, Minn., and Buffalo, Minn.
Once farmers drive the dumpsters home, Revolution picks up the plastic from them on a regular schedule, determined by the size of the farms, mostly dairies, and the amount of plastic used.
“I have some farms where I collect as much as every other week, and I have some farms where it’s maybe two or three times per year,” Murphy said. “We try to help as many farmers as possible, large and small farms alike, and we just put them on different route schedules.”
Jeff Beckman, owner of Golden Meadows Dairy, about 35 miles south of Minneapolis, was one of 110 farmers to pick up a dumpster in late May in Goodhue County.
“As I’m feeding the cows each day, I cut off the plastic that I’m feeding off and I put it in the dumpster,” he said. “It’s as simple as five minutes and we’re done.”
With 100 cows, Beckman said he was spending $1,700 a year to have 3,000 to 4,000 pounds of plastic trucked to a landfill, and he now gets it picked up once every eight weeks for free.
“In farming today you have to be very cautious about what you spend, so any time you can recycle or reuse something, it’s just to our advantage,” he said. “It’s also a gain for the environment, so it’s fun when things are a double win.”
Brita Sailer, executive director of the nonprofit Recycling Association of Minnesota, said many farmers in the past 20 years have increasingly turned to plastic covers or bags to store hay and silage — chopped up cornstalks — that are fed to cows. The bags are safer and less expensive than the traditional method of storing the fodder in silos, she said, and they also keep the silage fresher and help it retain more nutrients.
But Sailer said the bags, which can range from 100 to 300 feet long and 6 to 12 feet tall, created a waste problem that the state didn’t have before and there was no way of coping with it other than landfills. For farmers who use the bags or covers, she said, the amount of plastic used per cow amounts to 15 to 20 pounds per year.
Revolution Plastics is not the first business to be interested in the waste plastic, Sailer said, but it’s the first to offer free pickup and have its own processing plants. Other firms also are working on projects to recycle plastic waste from the marina industry, she said, which uses massive amounts of blue plastic to cover boats and protect them during winter.
Charles Krause, a dairy farmer near Buffalo, west of Minneapolis, said that he uses plastic mainly to cover bunkers of silage for his 200-cow operation. Krause said he tried to obtain a dumpster twice earlier this year but was unsuccessful because they were all spoken for. Late last month he was finally able to pick up a dumpster and said it’s “awesome” that he won’t need to pay for the plastic to be picked up.
“The nice thing about Revolution is they’re not funded by a grant, because a lot of programs get started and then they’re done when the grant runs out,” Krause said. “Hopefully this will be a long-term solution.”
Achieving success in recycling programs depends both on the markets and being able to connect the dots, said Wayne Gjerde, recycling market development specialist at the Minnesota Pollution Control Agency.
“It still gets back to the basics of where’s the material, do you have enough of it, are there things that you can make it into and who’s going to do that,” he said.
After on-farm pickups, Revolution bales the plastic and ships it by truck or rail to its processing plant in Arkansas. There the plastic is washed, shredded, heated and extruded into plastic resin pellets, which can be used to make other products such as bags or construction films.
The company accepts agricultural plastic bags and wraps but not other plastics or nylon such as netting used to secure bales. Its collection system does not cover the entire state but uses hubs near concentrations of dairies that are economical to service.
“We understand what we’re getting into,” said Murphy. “It’s not a huge moneymaker as much as it’s a product we can use that not only keeps it out of the landfill but uses less energy than virgin resin to produce other products.”
Morse said that 146 of the 172 dairy farms in Winona County with more than 100 cows are now participating in the program. Murphy said that 1,132 dumpsters have been distributed in Minnesota and about 3,300 in Wisconsin, with 3,000 more farmers in the two states signed up and waiting for future deliveries.
Morse said the best part of the program is that Revolution’s sister company in Arkansas uses the recycled plastic to produce plastic trash liners and other products.
Winona County spent two months testing the liners for garbage cans in its parks and public buildings, she said, and has now decided to buy them after finding that the recycled bags were just as strong and less expensive than liners the county was using previously. Three Rivers Park District is also buying the recycled bag liners, and its suburban system uses about 33,000 of them annually.
“We’ve literally closed the loop — buying back a product that was made from materials we recycled — which is pretty much the holy grail for recycling,” Morse said. “That’s a big achievement for us.”
Switching from coal to natural gas will not save our planet
The Seattle Times Opinion
Switching from coal to natural gas will not save our planet
 Workers move a well casing at a Chesapeake Energy natural gas well site near Burlington, Pa. (Ralph Wilson / The Associated Press)
Bill McKibben, Special to The Times August 8, 2017
If as little as 3 percent of natural gas leaks in the course of fracking and delivering it to the power plant through a pipe, then it’s worse than coal.
MOST magic tricks and confidence games mostly work the same way — a little bit of misdirection to get the audience looking in the wrong direction. And some of the finest magicians at large in America today are its natural-gas salesmen, who have worked hard to reassure us that they’re part of the solution to the global warming crisis. To understand why that’s a ploy — to understand why they’re in fact helping drive the heating of the planet — you have to pay close attention.
The basic move is to insist that natural gas helps cut carbon emissions. Indeed, as Dan Kirschner, the head of the Northwest Gas Association, put it in his recent Op-Ed [“The power of natural gas in the war on carbon emissions,” Aug. 3, Opinion], “the U.S. leads the world in absolute reductions in carbon emissions, due in large part to the increased availability and affordability of natural gas.”
This is true on the surface. As America’s power plants have replaced coal with fracked gas, carbon emissions have fallen because natural gas produces half as much CO2 as coal when you burn it. The problem is, carbon emissions are not the only thing that drive global warming. There’s another gas that does the job even more powerfully: CH4, or methane, which is the scientific name for natural gas. If it leaks unburned into the atmosphere, then methane traps heat about 80 times more effectively, molecule for molecule, than CO2. The point of this chemistry lesson is: If as little as 3 percent of natural gas leaks in the course of fracking and delivering it to the power plant through a pipe, then it’s worse than coal.
And, sadly, it’s now clear that leakage rates are higher than that. In January 2013, aerial surveys of a Utah fracking basin, for instance, found leak rates as high as 9 percent. Data from a Harvard satellite survey showed that between 2002 and 2014, U.S. methane emissions increased more than 30 percent.
In fact, some experts who have reviewed the data say that because of the boom in fracking and the conversion to gas, America’s total greenhouse-gas emissions may actually have gone up during the Obama years. And at least the Obama administration required drillers to keep track of how much methane they were leaking — one of the first acts of the Trump EPA was to scrap that requirement, apparently on the grounds that what you don’t know can’t hurt you.
So, to summarize, because this is a subtle point that citizens, politicians and editors need to understand, given the importance of the debate: Natural gas is not reducing the amount of greenhouse-gas emissions. It is doing nothing to slow climate change.
And worse, it’s making it much harder to take the steps that really would matter. As we get off coal because of the way it drives climate change, what we should be doing is moving to renewable energy. Solar power emits no carbon at all, which makes it the natural choice. But as long as we have cheap natural gas flooding the market, we’ll move more slowly in the direction of real renewables. Cutting greenhouse-gas emissions by burning natural gas is like dieting by eating reduced-fat cookies, explained the principal investigator of a Stanford forum that studied the explosive growth in natural gas: “If you really want to lose weight, you probably need to avoid cookies altogether.”
Which is truly sad, because the solar panel is the great have-your-cake-and-eat-it technology of all time — the real deal. It takes the power the sun sends us every day and turns it into electricity. There’s no catch, no con. It’s our Houdini escape route from climate change — but only if we catch on in time to the tawdry little three-card-monte game the fossil-fuel industry is running.
Bill McKibben is the Schumann distinguished scholar in Environmental Studies at Middlebury College and founder of the global climate campaign 350.org.
The simple secret to why Californians are paying less for Obamacare plans
ThinkProgress
The simple secret to why Californians are paying less for Obamacare plans
Hint: look at California.
Amanda Michelle Gomez August 8, 2017

Peter Lee, executive director of Covered California, the state’s health insurance exchange, talks at a news conference in Sacramento, Calif. (AP Photo/Rich Pedroncelli, File)
“Rising premiums” has been the rallying cry for Republicans looking to repeal the Affordable Care Act (ACA). Lawmakers pointed to 2018 premium hikes as a big reason to repeal and replace current health law. Some insurance companies are requesting especially high rates for 2018 ACA plans, as high as 30 percent more in some states.
In California, statewide premiums will rise 12.5 percent, and some northern counties will see a 33 percent increase. But most California residents could avoid the soaring premiums rates, as they’ve done in the past, by shopping smart. That’s easier to do than in a lot of other states, because California is helping make their health care shopping simple.
“Consumers are price-sensitive,” senior fellow with NORC at the University of Chicago Jon Gabel told ThinkProgress. “Consumers search for lower-cost plans, and tend to move from high-cost to low-cost plans.”
Gabel is the author of a recent study by The Commonwealth Fund that found California residents on average pay less for insurance than advertised rates suggest. He and other researchers tracked premiums for ACA plans offered versus plans purchased. Using enrollment data between 2014-2016, the study found customers respond to price increases by switching to cheaper plans.
“For example, just like ordinary grocery shopping, customers will likely purchase green apples when the price for red apples goes up,” Gabel said. It’s economics 101, he inferred.
In 2014, Californians paid 11.6 percent less than the advertised premiums and by 2016, they paid 15.2 percent less. Consumers were able to mitigate the full impact of reported premium hikes, and it’s likely they’ll do this again in 2018, Gabel said. The state’s ACA exchange, dubbed Covered California, cited the study when it announced preliminary rates last week, signalling to consumers that they could purchase cheaper plans if they choose wisely.
“It’s never great when rates increase,” Anthony Wright, executive director of the California health consumer advocacy group Health Access, told ThinkProgress. “But the ACA provides a framework to deal with those rate increases.”
The ACA subsidizes premiums and out-of-pocket costs so costumers don’t feel the brunt of rising insurance costs. Eighty-six percent of Cover California enrollees receive tax credits to help pay for premiums. In other words, the federal government picks up the bulk of the tab when insurers raise prices.
“For those who do not qualify for subsidies, they have the ability to shop and switch for a better deal,” said Wright. The California exchange echoed this point, citing that almost 55 percent of consumers will either be able to pay less or see a rate go up by no more than 5 percent if consumers switch plans.
Covered California does a better job at simplifying the shopping experience than most states. California is among three states that helps customers shop smart by only offering standardized options for plans offered in each metal tier. Standardization plans have fixed out-of-pocket limits and benefits. This allows costumers to make apples-to-apples comparisons when they are shopping around for a plan in each metal tier. The Centers for Medicare and Medicaid Services (CMS) advises insurers to create standardized options for sale but does not require them.
Gabel attributes Covered California’s easy-to-understand exchange as a driving force behind consumers purchasing lower-premium plans. Given the study limitations, it’s difficult to determine if Californians shops more than other states because of how its exchange is set up. An Avalere study suggests that only about one third of enrollees who purchased health care on the federal marketplace in 2016 kept their same plan from 2015. (Twenty-eight states use the federally-facilitated marketplace.)
Wright did acknowledge that changing plans could mean changing a provider. “This might not be an option for someone committed to provider or network,” he said, “specifically someone undergoing specific treatment.”
Additionally while consumers look to sidestep high premium costs, they passed on other subsidies. Another recent study led by Harvard Medical School showed that nearly one-third of California enrollees signed up for bronze plans, which have cheaper premiums, instead of silver plans, which is the only metal plan that offers cost-sharing subsidies. Wright said when Covered California became privy to this, Health Access went out of their way to inform consumers of their eligibility.
With the onus on the consumers, there are bound to be missteps along the way despite best efforts to streamline the process — but for now California could offer a lesson to other states.
The U.S. economy is “broken” — here’s the proof
Money Watch
The U.S. economy is “broken” — here’s the proof
By Alain Sherter, MoneyWatch August 8, 2017
Many Americans correctly perceive the U.S. as a land of “haves” and “have-nots,” reflecting the erosion of the middle class and a growing public awareness of economic inequality. Less widely understood is where the “have-just-about-everythings” fit into the mix.
As a chart making the rounds starkly shows, it is only those at the apex of the income ladder – the 0.1 percent atop the 99.9 percent – that have seen a significant gain in their income over the last three decades. The numbers speak for themselves.
Between 1980 and 2014, income for the middle 40 percent of U.S. households – meaning those with average pre-tax earnings of $65,300 – rose a total of 42 percent. That’s about 1.2 percentage points per year.
By comparison, income for the top 1 percent during that period – people with average income of $1.3 million – rose 204 percent, or 6 percent a year. But the really big gains accrue still higher up the ladder.
Income for the top 0.1 percent ($6 million in average income) jumped 320 percent between 1980 and 2014. And it positively exploded for the richest Americans: Income for the .001 percent (average income of $121.9 million) shot up 636 percent, or nearly 19 percent per year.
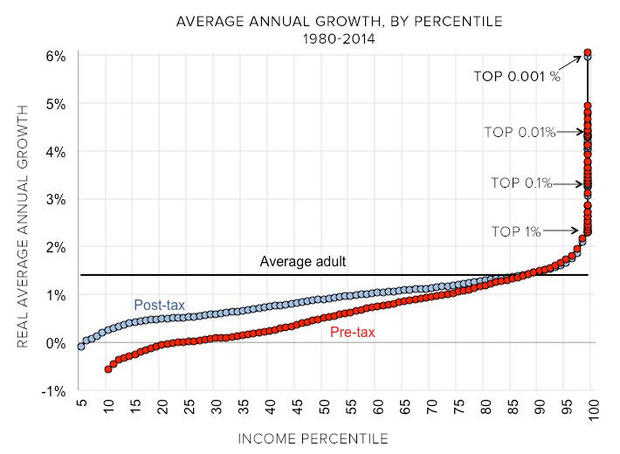 Thomas Piketty, Emmanuel Saez, Gabriel Zucman
What do such figures say about the American economy?
“The most important takeaway is that the U.S. economy is broken,” said Gabriel Zucman, co-author of the study that produced the chart and one of the country’s leading experts on inequality, by email. “Since 1980, there has been no growth for half of the population (the bottom 50 percent of income earners) and only very limited growth for the bottom 90 percent, while a tiny minority (the top 1 percent) has seen its income skyrocket.”
Here’s what the chart means in dollars and cents: Since 1980, average pre-tax income for people in the the top 1 percent has tripled, to about $1.3 million a year (as of 2014). For those in the bottom 50 percent, income has idled at around $16,000.
In other words, it’s back to the future, with the income gap in the U.S. roughly at the same level as in the late 1920s. Just before the Great Depression, the wealthiest 1 percent of Americans collected nearly a quarter of the nation’s income, while the bottom 90 percent got just over two-thirds. Today, the 1 percent have roughly 20 percent of national income.
Sure, skeptics might ask, wasn’t America always somewhat lopsided in its distribution of wealth, rightfully rewarding those individualists bumptious enough to build empires while leaving comparatively less for average folks?
Not really. Between 1946 and 1980, income for the bottom 10 percent rose faster than that of the top 10 percent. Poorer Americans saw the biggest gains – a 179 percent growth in income during those years. The bottom half of income-earners saw their income grow more than 100 percent, compared with 57 percent for the .001 percent.
“From 1946 to 1980 incomes were growing at roughly the same pace for everybody, and macroeconomic growth was strong,” said Zucman, an economist at the University of California-Berkeley (whose co-authors for the study included two other leading inequality scholars — Thomas Piketty of the University of Paris and Emmanuel Saez, also of UC Berkeley). “This shows that it is possible to have an economy that is both dynamic and equitable.”
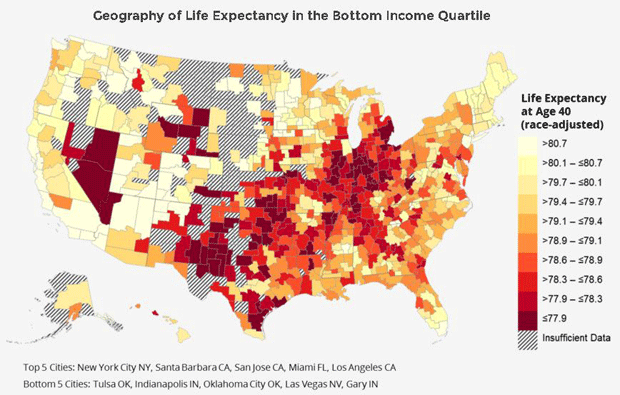 Health Inequality Project
Not surprisingly, the tidal shift in who earns what in the U.S. is expressing itself in other ways — like who lives longer. Over the last 30 years, the life expectancy of low-income workers has stagnated, and even declined in some parts of the country. (Life expectancy is an estimate of how many more years a person has to live at a given age, while the mortality rate refers to the number of deaths over a given period of time.)
As a result, a 40-year-old man in the top 1 percent of U.S. income earners can expect to live to 87, economic research shows. Among the bottom 1 percent, a man of the same age can expect to make it to 72. The main reason for that divergence, as economists Anne Case and Angus Deaton showed last year: a surge in deaths among people in this group from drug and alcohol abuse and from suicide.
That’s not merely a sign of a troubled economy — it’s broken.