Chicago Tribune
Farmers in Wisconsin and Minnesota are now recycling millions of pounds of plastic
Tom Meersman, Minneapolis Star-Tribune August 9, 2017
Minnesota and Wisconsin farms generate 60 million to 80 million pounds of plastic each year but until now had no real options to recycle it. They had to make a choice of paying for it to go to a landfill, burying it on their own land or illegally burning it — none of them, they knew, good for the environment.
An Arkansas company has come up with a solution: In the past two years, it has given more than 4,400 dumpsters to farmers in the two states and then picked up the waste to turn into trash bags that are being used in parks locally.
“Recycling Ag plastics is a problem that’s bedeviled me for 20 years,” said Anne Morse, recycling and sustainability coordinator for Winona County in southeastern Minnesota. “There wasn’t a system that I could set up that made sense and wasn’t extremely costly.”
That ended last December, when Winona became the first county in the state to welcome Revolution Plastics, the Arkansas-based company that has been in the plastics recycling business in Southern states since 1996.
Revolution, wanting to expand its reach, set up pilot programs in the Midwest in 2014 and 2015 and initiated a full launch in Minnesota and Wisconsin last year, said Price Murphy, the company’s director of operations.
Farmers who use at least 2,000 pounds of plastic a year can sign up for the program, Murphy said. More than 100 dumpsters will be distributed in Fergus Falls, Minn., and Buffalo, Minn.
Once farmers drive the dumpsters home, Revolution picks up the plastic from them on a regular schedule, determined by the size of the farms, mostly dairies, and the amount of plastic used.
“I have some farms where I collect as much as every other week, and I have some farms where it’s maybe two or three times per year,” Murphy said. “We try to help as many farmers as possible, large and small farms alike, and we just put them on different route schedules.”
Jeff Beckman, owner of Golden Meadows Dairy, about 35 miles south of Minneapolis, was one of 110 farmers to pick up a dumpster in late May in Goodhue County.
“As I’m feeding the cows each day, I cut off the plastic that I’m feeding off and I put it in the dumpster,” he said. “It’s as simple as five minutes and we’re done.”
With 100 cows, Beckman said he was spending $1,700 a year to have 3,000 to 4,000 pounds of plastic trucked to a landfill, and he now gets it picked up once every eight weeks for free.
“In farming today you have to be very cautious about what you spend, so any time you can recycle or reuse something, it’s just to our advantage,” he said. “It’s also a gain for the environment, so it’s fun when things are a double win.”
Brita Sailer, executive director of the nonprofit Recycling Association of Minnesota, said many farmers in the past 20 years have increasingly turned to plastic covers or bags to store hay and silage — chopped up cornstalks — that are fed to cows. The bags are safer and less expensive than the traditional method of storing the fodder in silos, she said, and they also keep the silage fresher and help it retain more nutrients.
But Sailer said the bags, which can range from 100 to 300 feet long and 6 to 12 feet tall, created a waste problem that the state didn’t have before and there was no way of coping with it other than landfills. For farmers who use the bags or covers, she said, the amount of plastic used per cow amounts to 15 to 20 pounds per year.
Revolution Plastics is not the first business to be interested in the waste plastic, Sailer said, but it’s the first to offer free pickup and have its own processing plants. Other firms also are working on projects to recycle plastic waste from the marina industry, she said, which uses massive amounts of blue plastic to cover boats and protect them during winter.
Charles Krause, a dairy farmer near Buffalo, west of Minneapolis, said that he uses plastic mainly to cover bunkers of silage for his 200-cow operation. Krause said he tried to obtain a dumpster twice earlier this year but was unsuccessful because they were all spoken for. Late last month he was finally able to pick up a dumpster and said it’s “awesome” that he won’t need to pay for the plastic to be picked up.
“The nice thing about Revolution is they’re not funded by a grant, because a lot of programs get started and then they’re done when the grant runs out,” Krause said. “Hopefully this will be a long-term solution.”
Achieving success in recycling programs depends both on the markets and being able to connect the dots, said Wayne Gjerde, recycling market development specialist at the Minnesota Pollution Control Agency.
“It still gets back to the basics of where’s the material, do you have enough of it, are there things that you can make it into and who’s going to do that,” he said.
After on-farm pickups, Revolution bales the plastic and ships it by truck or rail to its processing plant in Arkansas. There the plastic is washed, shredded, heated and extruded into plastic resin pellets, which can be used to make other products such as bags or construction films.
The company accepts agricultural plastic bags and wraps but not other plastics or nylon such as netting used to secure bales. Its collection system does not cover the entire state but uses hubs near concentrations of dairies that are economical to service.
“We understand what we’re getting into,” said Murphy. “It’s not a huge moneymaker as much as it’s a product we can use that not only keeps it out of the landfill but uses less energy than virgin resin to produce other products.”
Morse said that 146 of the 172 dairy farms in Winona County with more than 100 cows are now participating in the program. Murphy said that 1,132 dumpsters have been distributed in Minnesota and about 3,300 in Wisconsin, with 3,000 more farmers in the two states signed up and waiting for future deliveries.
Morse said the best part of the program is that Revolution’s sister company in Arkansas uses the recycled plastic to produce plastic trash liners and other products.
Winona County spent two months testing the liners for garbage cans in its parks and public buildings, she said, and has now decided to buy them after finding that the recycled bags were just as strong and less expensive than liners the county was using previously. Three Rivers Park District is also buying the recycled bag liners, and its suburban system uses about 33,000 of them annually.
“We’ve literally closed the loop — buying back a product that was made from materials we recycled — which is pretty much the holy grail for recycling,” Morse said. “That’s a big achievement for us.”

 Global average CO2 each month since 1980. CREDIT: NOAA.

 Associated Press
 The Dry Lake Wind Power Project in Arizona. CREDIT: Department of Energy


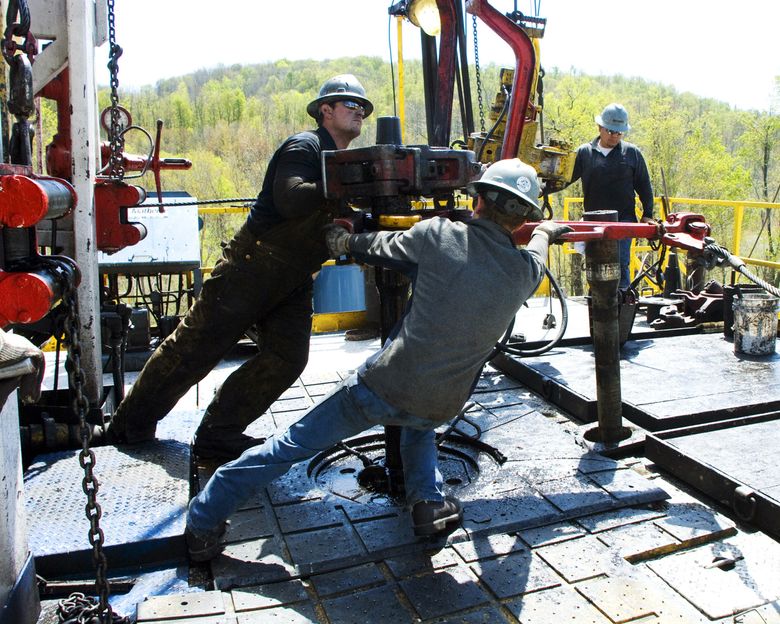 Workers move a well casing at a Chesapeake Energy natural gas well site near Burlington, Pa. (Ralph Wilson / The Associated Press)