Will DeSantis run for president? The candidate I saw during the Florida debate is worrisome.
Carli Pierson, USA TODAY – October 30, 2022
If there were a recipe to make another Florida Gov. Ron DeSantis it might go something like this: Grab some playground bully off the shelf with a heaping teaspoon of science denial, a swig of race-baiting and a lump of LGBTQ bigotry for good measure.
If it sounds nasty, that’s because it is (recipe and politics).
As a former Floridian who visits as often as possible, and because I have close family that still lives there, I care deeply about what goes on in the Sunshine State and worry about where DeSantis is heading politically.
Not everyone agrees with me. During the first and only gubernatorial debate with former Republican Gov. and now Democratic Congressman Charlie Crist on Monday night in Fort Pierce, DeSantis got a concerning amount of applause for his hateful, misleading and divisive comments. Before the debate, DeSantis was also leading in the polls and has proved to be popular in Florida.
After the debate, he went back to being favored to be a GOP candidate running against former President Donald Trump (should he run) in the 2024 presidential election. It’s with that in mind that I’m writing about the debate. What kind of candidate would DeSantis be for the 2024 campaign? And, God forbid, what kind of president?
The debate was a good window into that.
Crist and DeSantis at gubernatorial debate
What DeSantis said during the debate
I didn’t ever imagine myself saying this because I am an atheist, but as I watched Monday night’s debate, I found myself praying Crist becomes governor again. No matter how much I dislike millionaires getting into politics, DeSantis’ far right ideology makes me nervous. But how will more centric and independent voters feel about his rhetoric?
DeSantis made some really troubling comments during the debate. He also has a record of troubling, bigoted leadership that has no place in 2022 America, or 2024:
►When asked by local news anchor Liz Quirantes about his “Stop WOKE” Act and his Florida Parental Rights in Education Act – which critics have called the “Don’t Say Gay” law because it bans classroom instruction on sexual orientation and gender identity for students in kindergarten through third grade – DeSantis went on a tangent dog-whistling about keeping Florida free. He also stooped to his habitual race baiting saying, “I don’t want to teach kids to hate our country,” and claimed that it was false that the United States was built on “stolen lands.”
DeSantis isn’t mature enough to be governor or president
DeSantis, like others in his party, seems to be unable to realize that he is (and would be if elected) the governor of all Floridians, not just the ones who agree with him. But his radical positions send progressives, moderate Democrats and even independents running in the opposite direction.
That won’t stop if he decides to run for president.
DeSantis’ inability to answer Crist’s question about whether he would serve the full term, if elected, made it painfully clear that he doesn’t care about being governor – he wants to be president. Rather than answering the question honestly, he mumbled something and then reverted to his inner playground bully by calling Crist a “worn-out old donkey.” A “yo mamma” joke would probably have had the same effect: Rally the base; make everyone else cringe.
DeSantis doesn’t really want to be governor for much longer and he doesn’t want to listen to American voters – he wants to be president so he can push his radical agenda from the White House.
Carli Pierson, a New York licensed attorney, is an opinion writer and a member of the USA TODAY Editorial Board.
EPA closed a refinery that rained oil. Now it’s a ‘ticking time bomb.’
Maxine Joselow, The Washington Post – October 28, 2022
WASHINGTON – An oil refinery in the U.S. Virgin Islands that the Environmental Protection Agency shut down in spring 2021 now poses the risk of a fire, explosion or other “catastrophic” releases of “extremely hazardous substances,” the agency found in a report released this week.
The idled plant on St. Croix, formerly known as the Limetree Bay refinery, experienced a series of accidents over the course of last year that spewed noxious fumes and showered oil droplets onto nearby homes, sending some residents to emergency rooms. Now deteriorating conditions at the massive facility, which was sold in a bankruptcy auction in December, pose a major test of the Biden administration’s commitment to environmental justice.
In September, the EPA conducted an inspection of the refinery and observed “significant corrosion” of equipment including valves, pipes and pressure relief devices, the agency said in a letter sent to the owners’ lawyers Oct. 13 and made public this week.
“These conditions demonstrate a risk of imminent release of extremely hazardous substances,” the EPA said in an inspection report. “Because of this degree of corrosion, the vessels, piping, and/or valves may fail, resulting in a catastrophic release.”
Local residents question why federal officials have not done more to protect the health of this Caribbean island’s largely Black and Brown population.
“This report is equally alarming and affirming to those of us in the civic sector who have been sounding the bullhorn about the dangers posed by this refinery for years,” Deanna James, president of the St. Croix Foundation, said in an email. “Since 2019, St. Croix Foundation and our nonprofit partners have been on a lonely advocacy journey trying to compel policymakers to consider alternatives to this ‘ticking time bomb’ on our shores – to no avail.”
Elías Rodríguez, a spokesman for EPA Region 2 – which oversees New Jersey, New York, Puerto Rico, the U.S. Virgin Islands and eight Native American tribes – said the agency is “continuing its vigilant oversight” of the refinery.
“EPA takes very seriously our duty to ensure that the facility complies with federal environmental rules designed to protect people,” Rodríguez said in an email. “EPA will use its authorities to protect the protect the health and safety of the facility workers and those who live in nearby communities.”
The refinery, which received approval to operate during the Trump administration, has come under closer scrutiny since Biden took office. The EPA shut down the facility in May 2021 after residents across the island reported feeling nauseous and ill from the release of gaseous fumes.
In particular, EPA inspectors voiced concern about equipment containing ammonia and liquefied petroleum gas. Exposure to high levels of ammonia can cause a burning sensation in the eyes, nose and throat and can result in lung damage or death, according to the Centers for Disease Control and Prevention.
After the facility’s previous owners filed for bankruptcy in July 2021, a bankruptcy judge approved the plant’s sale for $62 million in December to West Indies Petroleum and Port Hamilton Refining and Transportation.
Reached by phone on Thursday, Fermin Rodriguez, vice president and refinery manager for Port Hamilton Refining, said the company is “working with EPA and we’re providing all of the information that they requested. And we’re going to have independent inspectors here this week to validate what they indicate in the report.”
In a news release issued Wednesday, the company sought to reassure local residents and indicated that it plans to restart the refinery when it is safe to do so.
“[D]espite recent reports of concerns about the safety of the facility, the company continues maintaining the facility it purchased in January of this year in preparation for a safe start-up,” the company said. “. . . As we have stated before, the safety of our refinery employees and the safety of the community is our number one priority.”
In June, West Indies Petroleum denied its ownership interest in the facility, despite having won the bankruptcy auction. Representatives for the firm could not be reached for comment.
Judith Enck, who was tapped by President Barack Obama to lead EPA Region 2, expressed alarm that the agency waited nearly three weeks after the inspection to send the letter to the plant’s attorneys.
“This is not a situation where you politely exchange letters between lawyers,” said Enck, who now heads the Beyond Plastics advocacy organization. “This is a serious situation that needs the attention of the highest levels of EPA.”
Enck called on EPA Administrator Michael Regan to “cancel his weekend plans” and immediately board a flight to St. Croix, where she said the agency must inform residents of the imminent threats to their health. A recent survey found that roughly 20,000 people live downwind of the refinery, while in an earlier 2019 analysis, the EPA noted that 75 percent of residents of adjoining neighborhoods are people of color and 27 percent live below the poverty line.
Rodríguez, the EPA spokesman, said the agency took three weeks to send the letter because “time was required, especially with a facility of this size and complexity of the issues involved.”
Jennifer Valiulis, executive director of the St. Croix Environmental Association, lives about two miles from the plant and questioned whether the federal government would act with more urgency if the situation were unfolding in the contiguous United States.
“Not only are the surrounding communities primarily Black and Brown, but also as a territory, we have a different status in that we don’t vote for the president,” Valiulis said. “We don’t have a voting member of Congress. And so we have less ability to advocate for ourselves.”
Oil giants sell thousands of California wells, raising worries about future liability
Mark Olalde, Co-published with ProPublica – October 27, 2022
Aera Energy wells in Ventura. The joint venture between Shell and Exxon has announced plans to sell thousands of California gas and oil wells to the German assett management group IKAV. (Myung J. Chun / Los Angeles Times)
The price of oil produced in California this year reached its highest level in a decade. President Biden is releasing millions of barrels of oil from the Strategic Petroleum Reserve to keep prices in check. And fossil fuel companies’ earnings are so high that Gov. Gavin Newsom has called for a windfall tax on their profits.
It might seem like a lucrative time to drill for oil in the Golden State. Yet, some of the world’s largest oil companies, several of which have done business in the state for more than a century, are selling assets and beginning to pull out of California.
Even with strong cash flow in the short term, producers have more to gain from offloading wells and the associated liability — chiefly expensive environmental cleanup — than from pumping more oil and gas, experts say.
“This is the kind of deal you see when an industry is in its twilight,” said Andrew Logan, senior director for oil and gas at Ceres, a nonprofit focused on sustainability in companies and markets.
Some industry experts, lawmakers and environmentalists are concerned about the recent deals, noting that the sales shift environmental liability from corporate powerhouses to less-capitalized firms, increasing the risk that aging wells will be left orphaned, unplugged and leaking oil, brine and climate-warming methane. They see a threat that the state’s oil industry could repeat a pattern seen in other extractive industries like coal mining and lead to taxpayers bearing cleanup costs.
California Assemblymember Steve Bennett, a Democrat who has long worked on oil policy, has seen oil companies in his Ventura district walk away from environmental liability. “It gets passed on to a smaller company and to a smaller company until someone declares bankruptcy and the public is stuck with the cleanup bill,” he said.
IKAV enters the fray
Supermajors Shell and ExxonMobil recently agreed to sell more than 23,000 wells in California, which they owned through a joint venture called Aera Energy, to German asset management group IKAV for an estimated $4 billion. Aera accounts for about a quarter of California’s oil and gas production, largely from pumping in Kern and Ventura counties.
Shell and ExxonMobil say the deal will strengthen their businesses.
But Greg Rogers, an attorney and accountant who researches the oil and gas industry, said the deal allows the sellers to shed decommissioning costs. “You got bad assets with big liabilities, and you can get rid of both at the same time. That’s a win for Exxon and Shell,” he said.
IKAV will inherit a portfolio littered with wells past their prime. Nearly 9,000 Aera wells were idle as of early October, meaning about 38% of the company’s unplugged inventory isn’t producing oil or gas, according to state data.
In an email, Aera spokesperson Kimberly Ellis-Thompson said the company is capable of managing its large portfolio of idle wells. “Since 2019, when new idle well management program regulations were published, we have met or exceeded the requirements for retiring idle wells,” she said. The company has decommissioned and plugged nearly 1,000 wells on average every year since then, she said.
IKAV, Aera’s soon-to-be new owner, manages about $2.5 billion in energy-focused assets. News releases on the Aera sale quoted Constantin von Wasserschleben, IKAV’s chairman, as saying, “We advocate a co-existence between renewable and conventional energy for decades to come.”
As the world increasingly shifts to cheaper renewable energy to address climate change, IKAV has been snapping up oil and gas wells from supermajors exiting the market. The firm, which once focused exclusively on renewable energy, began expanding into oil and gas in 2020 when it purchased BP’s gas assets in the San Juan Basin, spanning New Mexico and Colorado. The deal was part of BP’s push to divest $10 billion in assets, including aging American gas fields.
BP declined to comment.
If it’s not profitable to return wells to production, they need to be plugged. But if a company doesn’t plug its wells before walking away, wells are orphaned and the cleanup costs ultimately fall to taxpayers and current operators through fees.
For example, the Greka group of companies left more than 750 wells for California to plug when its wealthy owner began pushing his businesses into bankruptcy in 2016 and retired to his Santa Maria winery. And a subsidiary of one of the country’s largest mining companies, Freeport-McMoRan, left dozens of likely orphaned wells, state records show, even though the company brought in nearly $23 billion in revenue last year.
Greka’s CEO didn’t respond to a request for comment, and a Freeport spokesperson said the company is working with the state to verify details about its orphaned wells.
To minimize the government’s exposure if wells are orphaned, producers must put up a bond, typically held as cash or a surety policy. The bonds act like a security deposit: The company gets its bond back if it cleans up its mess, but the government keeps the money if the company orphans its wells.
Newsom has called for an end to all oil extraction in the state by 2045, but his administration has yet to use another tool to hold producers responsible for cleanup.
California has the authority to ask for an additional $30 million in financial security from a single operator but only requires Aera to hold a $3-million bond. As a result, Aera’s bonds cover less than half a percent of the $1.1 billion that ProPublica estimates it would cost the state to plug the wells based on the average cost to California for past well plugging. (That estimate does not include the additional cost of full surface remediation.)
California Oil and Gas supervisor Uduak-Joe Ntuk said in a statement that his agency reviews bonds for all oil companies in the state but did not say whether the amount of Aera’s financial security would be increased through the sale.
Aera, Shell and ExxonMobil did not respond to a question about the gap between their bonds and the estimated cost to plug their wells. IKAV did not respond to requests for comment. In an email, ExxonMobil spokesperson Meghan Macdonald said that “when we make divestments, we always try to work with partners like Aera and IKAV who are also committed to a lower-emissions future.”
Costs vary widely, but states have paid $100,000 or more to plug wells — and the same to clean up surface pollution — meaning there’s a significant gap between what’s needed and what California has available in bonds.
“If they don’t have the financial resources when it comes time to plug those wells, there’s a possibility that the public will be left holding the bag and paying those costs even though it’s the company that made the profit from selling the oil,” said Hollin Kretzmann, an attorney with the Center for Biological Diversity.
Who will be liable?
More than 240,000 wells have pierced the state since the late 1800s, when Southern California’s first producing well spouted oil near where Dodger Stadium now stands. Of those, more than 5,300 are “orphan, deserted, and potentially deserted wells,” according to data the California Geologic Energy Management Division published in September.
Many on that list belong to individuals who died long ago or companies that dissolved in the shuffling of corporate paperwork. However, some responsible parties are still around but are no longer legally liable after offloading their wells through sales and bankruptcies.
So who will be responsible for cleanup?
California is unique because state law allows regulators to call on former operators such as Shell and ExxonMobil to help pay for plugging onshore oil wells if they are later orphaned, even by a different owner. But companies have escaped responsibility under this stronger legal standard by exploiting loopholes such as a porous bankruptcy code.
Some experts question whether Shell and ExxonMobil would be required to pay if the wells they are selling to IKAV are ultimately orphaned, saying their ownership of the wells through a separate company, Aera, might shield them from liability.
“Exxon and Shell do not directly operate those wells. There’s corporate structuring going on in between,” Rogers said. And IKAV now adds another layer of corporate paperwork, holding the wells it acquired in New Mexico, Colorado and California through companies that were registered in Delaware shortly before the sales.
Alongside Aera, two other companies — California Resources Corp. and Chevron — account for the vast majority of California’s oil and gas production, and they too are shrinking their positions in the state. California Resources, which has been in and out of Chapter 11 bankruptcy in recent years, sold most of its Ventura Basin operations in November 2021. Chevron recently sold its California headquarters and plans to consolidate some of its unused Bakersfield office space as it shifts employees to Texas. Reuters reported in early October that Berry Corp., another large oil company that for many years has operated in California and Utah, was considering selling.
Berry did not respond to a request for comment.
Shell acknowledged its California wells were overvalued, suggesting the wells are even nearer to the end of their economic life than previously predicted. The company is wiping as much as $400 million off its books through the sale via an impairment charge.
Shell has been shedding assets in part to hand off associated greenhouse gas emissions. A 2021 Dutch court ruling ordered it to significantly reduce emissions, although the company has appealed the ruling. Zoe Yujnovich, the company’s upstream director, said in a news release about the sale of Aera that Shell will instead be “focusing on positions with high growth potential.”
For its part, ExxonMobil plans to focus on oil and natural gas that costs less to extract, Liam Mallon, president of ExxonMobil Upstream Co., said in a news release announcing the sale to IKAV.
Large public companies are handing off oil and gas assets around the country. Between 2017 and 2021, more than a quarter of oil and gas mergers and acquisitions took public companies private, with private equity often involved, according to a study conducted by the Environmental Defense Fund. The report voiced concern that private companies are less transparent and have less incentive to protect the environment.
California is just the beginning
With more than 2 million unplugged oil wells believed to be scattered across the U.S., California is the tip of the iceberg.
A massive boom in American oil and gas production over the past 15 years spurred by technological advances in hydraulic fracturing and horizontal drilling unlocked previously inaccessible geologic formations. But the shale revolution and current market highs buoyed by Russia’s invasion of Ukraine won’t last forever.
Longtime petroleum reservoir engineer Dwayne Purvis laid out the reality at a recent conference. This shale revolution revitalized only some oil fields, and more than 90% of the country’s unplugged wells are either idle or minimally producing and unlikely to make a major comeback, according to his research.
“The bulk of the wells are producing from plays where there is no hope of another deus ex machina,” Purvis said, referencing nearly depleted oil fields.
The oil industry also faces an impending decline in demand from the shift to renewable energy and the trend toward banning the sale of new internal-combustion engine cars, as well as plans to phase out drilling in metro areas.
“The overall industry is being assaulted right now through policy changes at the state and federal level. That’s the story writ large,” Rogers said. “The industry is dying.”
Olalde reports for ProPublica.ProPublica is a nonprofit newsroom that investigates abuses of power.
U.S. Officials Had a Secret Oil Deal With the Saudis. Or So They Thought.
Mark Mazzetti, Edward Wong and Adam Entous – October 26, 2022
President Joe Biden, center, is greeted by dignitaries as he arrives at King Abdulaziz International Airport in Jeddah, Saudi Arabia, on Friday, July, 15, 2022. (Doug Mills/The New York Times)
WASHINGTON — As President Joe Biden was planning a politically risky trip to Saudi Arabia this summer, his top aides thought they had struck a secret deal to boost oil production through the end of the year — an arrangement that could have helped justify breaking a campaign pledge to shun the kingdom and its crown prince.
It didn’t work out that way.
Biden went through with the trip. But earlier this month, Saudi Arabia and Russia steered a group of oil-producing countries in voting to slash oil production by 2 million barrels per day, the opposite of the outcome the administration thought it had secured as the Democratic Party struggles to deal with inflation and high gas prices heading into the November elections.
The move led angry Biden administration officials to reassess America’s relationship with the kingdom and produced a flurry of accusatory statements between the two governments — including a charge by the White House that Saudi Arabia was helping Russia in its war in Ukraine.
Lawmakers who had been told about the trip’s benefits in classified briefings and other conversations that included details of the oil deal — which has not been previously disclosed and was supposed to lead to a surge in production between September and December — have been left fuming that Crown Prince Mohammed bin Salman duped the administration.
This account is based on interviews with American officials and officials from Gulf Arab nations, as well as Middle East experts with knowledge of discussions between the two nations.
What happened over the last half-year is a story of handshake agreements, wishful thinking, missed signals and finger-pointing over broken promises. Far from rebuilding a relationship with a leader Biden had once pledged to treat as a “pariah” after the murder of journalist Jamal Khashoggi, the outcome has been another low point in America’s tumultuous ties with Saudi Arabia.
The episode is also a revealing example of how Saudi Arabia, under the leadership of its ambitious and often ruthless crown prince, appears eager to shed some of its longtime reliance on the United States, with Crown Prince Mohammed trying to position Saudi Arabia as a powerhouse of its own.
American officials said that, even days before the OPEC+ decision, they had received assurances from the crown prince there would be no production cuts — and when they learned of the Saudi reversal, they made a futile last-ditch push to change minds in the royal court.
The Saudi Energy Ministry said in a statement that “the kingdom rejects these allegations and stresses that such mischaracterizations made by anonymous sources are entirely false.”
The ministry added, “The decisions of OPEC Plus are reached by the consensus of all members and determined solely by market fundamentals, not politics.”
White House officials admit they were angered and surprised by what they said was a Saudi about-face, but insist their overall strategy to lower energy costs is working.
At the same time, U.S. officials are bracing for another potential price surge in December, if a European embargo on Russian oil goes into effect and the Saudis refuse to increase oil production to make up for the anticipated reduction in supply. The officials say that would be a sure sign that the Saudis were helping the Russians by undermining the American and European-led plan.
“While we clearly disagreed with the OPEC Plus decision in early October, we recognize the importance of continuing to work and communicate with Saudi Arabia and other producers to ensure a stable and fair global energy market,” said Amos Hochstein, Biden’s energy envoy.
Even some of the president’s staunchest supporters have called the episode an example of the administration sacrificing principles for political expediency — and having little to show for it.
“There’s now a level of embarrassment as the Saudis merrily go on their way,” said Rep. Gerald E. Connolly, D-Va., a member of the House Foreign Affairs Committee.
Biden administration officials began planning in the spring for the president to make a summit stop in Saudi Arabia while also visiting Israel over the summer. They knew such a trip would bring criticism.
But some of the president’s aides saw both short- and long-term benefits for the trip and had quietly tried to repair the relationship. They said it was important to work with the kingdom on the Yemen war and Iran, and to expand Israel’s acceptance in the region. More immediately, they believed, the trip could shore up a Saudi commitment to convince OPEC to increase oil production as Russia’s war in Ukraine had led to surging global fuel prices.
Leading proponents of the visit, including Hochstein and Brett McGurk, the top National Security Council official for Middle East policy, met during the spring with Crown Prince Mohammed and his advisers. American officials said that in May, they reached a private oil deal with the Saudis that had two parts.
First, the Saudis would accelerate an OPEC+ production increase of 400,000 barrels per day already planned for September, moving it to July and August. Then the Saudis would get the cartel to announce a further production increase of 200,000 barrels per day for each month from September to December of this year.
On June 2, OPEC+ announced they would move up the production increase scheduled for September — fulfilling the first part of the secret deal.
That same day, the White House announced Biden would soon make a trip to Saudi Arabia.
The price of oil was slowly dropping by the time Biden arrived in Jeddah, Saudi Arabia, on July 15 for his meeting with Crown Prince Mohammed and other Arab leaders. The image of the American president bumping fists with the Saudi crown prince he once vilified endures from the trip, but behind the scenes, White House officials believed they had at least shored up Saudi commitments on a number of fronts.
Saudis officials seemed eager to demonstrate to the Americans that they had delivered on their commitments — during the summit, they gave members of Biden’s delegation a chart showing oil prices had fallen to $101 per barrel, down from more than $120 per barrel after the war in Ukraine began.
The Americans came away from the summit with the belief that the agreement was on track and that Crown Prince Mohammed was satisfied. But in Riyadh, top Saudi officials were privately telling others that they had no plans for further meaningful oil production increases.
American officials say they believe that Crown Prince Mohammed was particularly influenced by a high-level Sept. 27 meeting in which Prince Abdulaziz, the energy minister, argued that cuts were needed to keep prices from plummeting. The U.S. officials said they learned Prince Abdulaziz asserted that the Saudi government would lack the resources to fund economic diversification projects at the heart of Prince Mohammed’s domestic agenda.
Some U.S. officials believe that the Russians influenced the Saudi about-face, pointing to Prince Abdulaziz’s strong working ties with top Russian officials close to Putin.
Saudi officials vehemently denied marching in lock step with Russia and said they have viewed themselves as a neutral mediator in Russia’s war with Ukraine. Some American officials said that an answer to whether Riyadh has truly cast its lot with Moscow will come on Dec. 4, when OPEC+ is scheduled to meet again.
‘Wonderful’ news: Fort Myers Beach rapidly restoring water service, whatever it takes
Phil Fernandez, Fort Myers News-Press – October 26, 2022
Fort Myers Beach Utilities Director Utilities Director Christy Cory and fellow departments heads, workers and leaders bore the brunt of frustration and anger last week from many of the nearly 200 at the Town Council’s first gathering since Hurricane Ian’s battering.
On Tuesday night, many of those same residents cheered Cory as she brought a surprising update to the council meeting on the rapid return of water service to Estero Island.
“As of today at close of business — and my guys are actually still out there — we had 62 side streets on. We had 51.2% of the island turned on,” Cory said.
“Say that again?” a voice blurted out.
“Your numbers are outstanding,” council member Jim Atterholt said, after the applause and whistling had subsided, and then occurred a half-dozen more times sprinkled with prolonged clapping, hurrahs and amens during a six-minute spurt as Cory spoke. “Your news is wonderful.”
That’s a dramatic surge from zero Friday morning on side streets.
“There’s two to three valves per side street. The debris is causing a little bit of a problem for us. I try to get the machines down there (to) get it out of the way so we can turn on a valve to a side street. Once we do that, then we immediately break up (to) individual” houses, Cory said. “I’m out there, my office staff is out there. We’re hitting each house individually because we’re watching (for) water coming out of the houses.”
“A case in point. We went to Bay Beach Lane today to get Bay Beach Lane turned on. It was a hot mess, for a lack of a better term. There was debris everywhere,” Cory said. “We are also repairing on the residents’ side just to try to get people’s water back to them. We’re just not repairing our side. We’re actually going onto property and helping people.”
That led to yet another eruption of cheers among the 150 or so at the makeshift setup inside the former SkipOne Seafood restaurant, 17650 San Carlos Blvd.
“We’re doing absolutely the best we can to get everyone water,” Cory said. “We’re out there at 5:45 (a.m.) with every one of my crew members. We start at daylight and we work until the sun goes down every single day. And we’ll continue to do that until every single resident on this island has water.”
With the previous complaints about the lack of service and too much caution and inspection as repairs continued, Mayor Ray Murphy and town council members had implored more creativity from Town Manager Roger T. Hernstadt and his team.
“If we feel that it’s safe, and we’re out there, and someone is home and we feel that it’s safe to turn on their water, we are doing so. Let me say that Roger has given me permission to do that,” Cory said. “If there’s a policy in place, I want to make it clear I didn’t go against that policy. Roger authorized me if I feel it’s safe as the director to turn on their water, I can do that.”
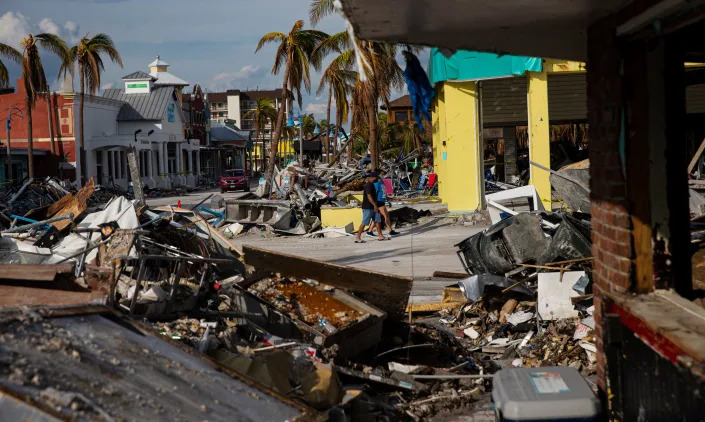
Times Square on Fort Myers Beach was destroyed in Hurricane Ian.
‘Literally, the street rose up’
But there are hazards.
“We went to Primo (Drive) to turn on that water, and the whole street, I mean, literally the street rose up, and we immediately shut it down,” Cory said. “I don’t want to devastate an area that’s devastated already. When it comes to a street like that, I want to keep moving but bring back my contractors to repair that, which they did today and that water’s turned on.
“So it’s just a matter of when we get to a street, then we have something like a main break. We had a valve blow up once the other day that basically comes out of the street.”
And then there’s the riskiness of residents turning on their own meters, Hernstadt said.
“We’ve had cases where people’s properties got flooded, and they’ll call us up, ‘My house is flooded.’ We don’t recommend you do that,” he said. “It’s wiser to turn on the meter when we’re there.”
Fort Myers Beach was destroyed by Hurricane Ian on Sept. 28, 2022. This is the Times Square area on October 14, 2022.
Cory said she understands inhabitants trying to get their lives closer to normal in any way they can.
“Previously, I would have told you not to touch that meter. Now, I’m just going to say, ‘If you want to turn on your water, you can go right ahead,'” Cory said. “If you could do that between sunrise and sunset, that would be amazing because the 1 a.m. (calls), phew.”
But while there’s some victory with water, it’s not like most residents who still have a standing structure could go home Tuesday night and repeatedly turn their lights on and off in celebration. A total of 177 buildings have been energized, according to FPL. The company continues to work with town officials on the more challenging mission of extending power, among the concerns raised Tuesday night by about a dozen speakers.
“There’s a big difference between electricity and water,” Cory said.
But Hernstadt said he’s working with staff to find ways to shorten the restoration process. It’s just a matter again of being careful on an island landscape covered in potential dangers after a storm that officially killed 118 Floridians, based on new state data Tuesday night. Lee County’s 57 leads, and Collier, Charlotte and Sarasota counties all lost eight lives each, second most.
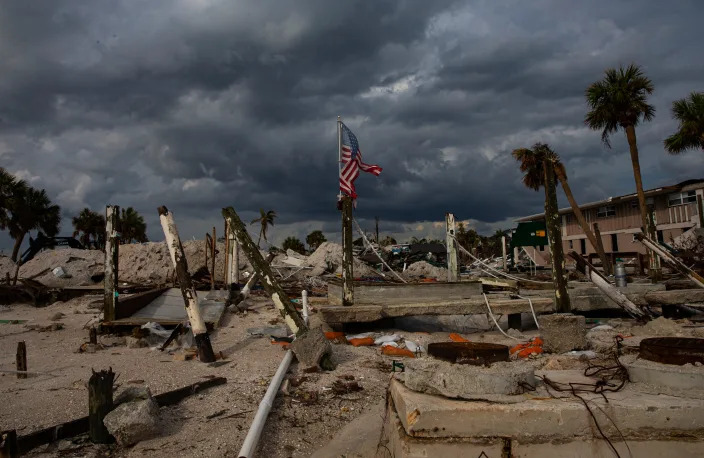
The Cottage Bar at Shuckers on Fort Myers Beach was destroyed in Hurricane Ian. An American flag was placed on one of the pilings that remains.
Threats remain: Leaking propane tanks
Threats to life continue a month after Ian’s Sept. 28 savagery of 15-foot storm surges and 155 mph winds that obliterated a majority of beachside dwellings and businesses.
“We are getting calls about underground propane tanks that are leaking, as people are cleaning up debris,” said Scott Wirth, Fort Myers Beach district chief of operations. “We have a hazmat team on the island that’s working with us in response so they’re there to help secure propane tanks that are leaking.”
Sinkholes and other obstacles also are in play.
“As you’re driving down the roads, you’ll see any kind of wash out,” Wirth said. “In some places that you see some of the road washed out, anticipate that there’s pockets of void spaces underneath the road. So if you see a washed out area, try to avoid it and go as far around it as you can, to avoid collapsing the road any further.”
The pier on Fort Myers Beach was destroyed in Hurricane Ian.
And residents are taking chances from a “life safety perspective” in some of their rebuild efforts.
“Unstable buildings — the work is continuing in these,” Wirth said, noting red or yellow placards. “These placards were put up by fire inspectors from around the state who came in and helped us inspect. (A) red placard means that there was something about your building that made it hazardous to be in, to the point where a certificate of occupancy provided for a commercial building has been revoked.”
Yellow’s a tad better.
“The yellow placard means your certificate of occupancy has been downgraded to a temporary certificate of occupancy. This building is safer to be in than one that is placarded in red,” Wirth said. “You’re working in that structure at your own risk. Those activities should be the types of things that would have to happen to get the building fixed until it can reach normal certificate of occupancy.
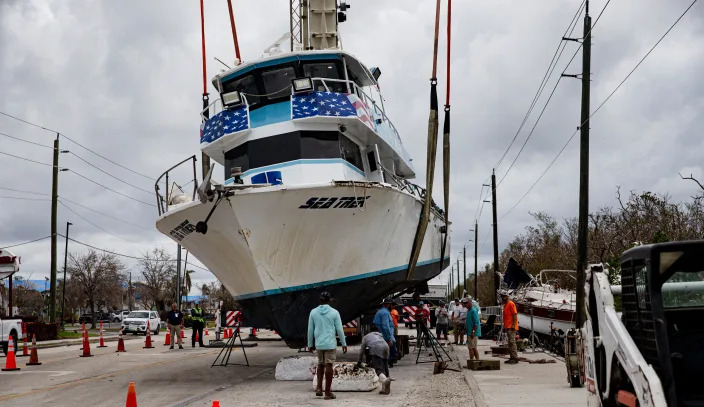
Crews using a crane removed the Sea Trek from the mangroves along San Carlos Boulevard on Tuesday, Oct. 18, 2022. A captain and a member of the crew were trying to save the boat during Hurricane Ian. As the storm surge from the storm rushed in, they ended up floating over the roadway and deposited in the mangroves. The hope is to repair the boat and return it to the water for working trips.
Other Beach updates from the town
• Inspections: Once electricity is restored in residential areas, residents need to get an inspection from a Florida licensed structural engineer and an electrician to get power. Both inspection reports need to be sent to buildingpermits@fmbgov.com, noting the address and the contractors’ Florida license number. In October, the town had processed 598 permits as of Tuesday. FPL is replacing meters on homes.
• Water service: Homes with potable water are under a mandatory boil notice, which will continue until samples show a return to safe drinking levels. All water used for consumption, cooking, making ice, washing dishes or brushing teeth must be brought to a rolling boil for at least one minute.
• Community Resource Centers: After being relocated from temporary town hall, there are two sites with hot meals from 11 a.m. to 5 p.m. daily and most other services 24 hours a day. Santini Marina Plaza, 7205 Estero Blvd., also features water, showers, laundry and restrooms. Diesel and regular unleaded fuel are available from 9 a.m. to 5 p.m. daily through Saturday. Fuel limits are 10 gallons per car and 15 per truck or SUV.
Beach Baptist Church, 130 Connecticut St., also provides access to ice, water, showers, laundry and restrooms as well as federal, state, local and non-profit partners, who are there from 9 a.m. to 5 p.m. daily. This includes FEMA Disaster Recovery Assistance Teams, Florida Department of Children and Families, and local and national non-profits.
• Mail pickup: Residents can pick up correspondence at the Fort Myers Processing & Distribution Center, 14080 Jetport Loop. For customers arriving by car, there is signage directing to a parking lot, where a mobile retail unit has been set up to assist in mailing and shipping needs, stamp and money order purchases and change of address requests. Hours: Monday through Saturday from 9 a.m. to 4:30 p.m.
• Early voting: Residents can vote at any of 12 sites in Lee County through Nov. 8 Election Day. Nearest to the beach include Wa-Ke Hatchee Park Recreation Center, 16760 Bass Road, Fort Myers; and Bonita Springs office for Lee County Elections office, 25987 S. Tamiami Trail, No. 105.
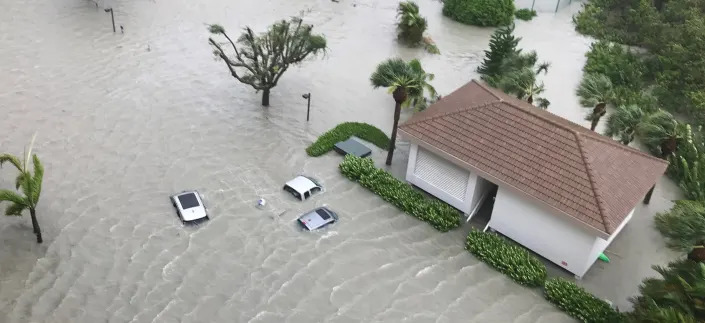
This parking lot near Naples Park flooded late Wednesday but by Thursday morning, the water had drained, leaving behind mud and debris.
• Damage assessments: In conjunction with the Army Corps of Engineers infrastructure assessment team and experts on design and construction, town building are conducting building assessments. The intent is to assess the habitability of a structure and recommend a rating of safe to enter, restricted use, or not safe to enter.
• Debris: Coordinating with Lee County, 168,397 cubic yards of debris had been collected as of Tuesday, or equal to more than 50 Olympic-sized swimming pools. It’s being deposited on the Bay Oaks recreational campus and Lovers Key. Some streets or homes may have been skipped due to obstruction from debris or parked vehicles in the right of way. As much as possible, debris should be pushed curbside.
• Fire inspection and permit fees suspended: The Board of Fire Commissioners and Fire Chief Ronald L. Martin have suspended fees into January.
• Roof permits: Access, complete and submit roof permits on the town’s website at www.fmbgov.com. Send questions to buildingpermits@fmbgov.com.
• Contractors: Use only licensed and registered contractors. A list of registered contractors of all types, including electrical, is on the Building Services page of the town’s website at www.fmbgov.com/building. Also available: the state’s database of licensed contractors at https://dcnonline.org/
Road leading to Vanderbilt Beach, Delnor Wiggins State Park and other Collier County venues remained closed Friday afternoon Oct. 14, 2022 in Hurricane Ian’s aftermath. Donations are being accepted at delnorwiggins.org to help pay for the wrecked Wiggins’ restoration, which officials say will take one to two years.
Where to find more help
At least three SBA Recovery Centers have been opened in Southwest Florida:
► The Naples Players, 701 Fifth Ave. S., Naples. Opens at 9 a.m. every day and closes at 4:30 p.m. Mondays and 5 p.m. Tuesday through Sunday.
► The Hub at SWFL Inc., 25071 Chamber of Commerce Drive, Bonita Springs. Hours are 9 a.m. to 5 p.m. Monday through Sunday.
► Kiwanis Club of Cape Coral, 360 Santa Barbara Blvd. S., Cape Coral. Times are 8 a.m. to 6 p.m. Monday through Thursday and closed on other days.
♦ President Biden has authorized Southwest Florida enterprises and private nonprofit organizations of any size to borrow up to $2 million to repair or replace damaged or destroyed real estate, machinery and equipment, inventory and other assets. Go to https://disasterloanassistance.sba.gov/
♦ Disaster loans up to $200,000 are available to homeowners to repair or replace damaged or destroyed real estate through FEMA or other agencies. Homeowners and renters are eligible for up to $40,000 to repair or replace damaged or destroyed personal property.
♦ The Florida Small Business Emergency Bridge Loan program provides short-term, zero-interest working capital loans to “bridge the gap” between the time a disaster impacts a business and when it can secure longer-term recovery funding, such as federally or commercially available loans. On Google, search “rebuild Florida business loan fund.”
♦ Disaster unemployment assistance is available to Florida businesses and residents. It’s for weeks of unemployment from Sept. 25 to April 1. For assistance call 1-800-385-3920, go to a local CareerSource Career Center or online to floridajobs.org.
Based at the Naples Daily News, Columnist Phil Fernandez (pfernandez@gannett.com) writes In the Know as part of the USA TODAY NETWORK. Support Democracy and subscribe to the paper.
Drought in the Great Plains and Midwest is getting more intense, federal report shows
Ben Adler, Senior Editor – October 26, 2022
A drought in the Great Plains and the Midwest has quickly grown in its size and severity in the last month, according to an update released Wednesday by the National Integrated Drought Information System (NIDIS). Currently, 60% of the North Central U.S. is in “moderate to exceptional drought” with 30% in “severe drought or worse” according to NIDIS, a division of the National Oceanic and Atmospheric Administration.
The worst-hit areas include Kansas, where 30% of the state is in exceptional drought, and Nebraska, which is 12% in exceptional drought. Smaller parts of Colorado, Missouri and South Dakota are as badly affected.
Drought conditions in July forced the state of Colorado to order an emergency public fish salvage for Queens Reservoir. (RJ Sangosti/MediaNews Group/Denver Post via Getty Images)
While the entire Midwest has been in a worsening drought for months, the western portions of the region — the Missouri River Basin and the Great Plains — have been hit the hardest. Water has dropped to “record low levels” on the Mississippi, Missouri and Ohio rivers, NIDIS reported, which has impeded boats and shipping. In total, 86% of the North Central U.S. is “abnormally dry” or worse.
“Over the last four weeks, many areas, particularly across the Midwest, have worsened by at least one drought category on the U.S. Drought Monitor and in some areas by two to three categories,” NIDIS reported in its update. “Drought has intensified most rapidly across southern Missouri, Kentucky, southern Illinois, southern Indiana, and northern Iowa.”
The water scarcity is causing dried-out soil — a major problem for the famously agricultural region, sometimes called “America’s breadbasket.” Last Saturday, Agence-France Presse reported that farmers in Kansas and Nebraska are “seeing crop yields in freefall, with some fields too damaged to harvest.” The Department of Agriculture recently lowered its projected yields of wheat, corn and soybeans.
“[Farmers] who are in their 70s and 80s are saying, you know, they haven’t even experienced anything like this in their lifetime,” Marc Ramsey, whose family has farmed in western Kansas for a century, told AFP. “So it’s pretty bad.”
A farmer harvests soybeans near Wyatt, Mo. (Scott Olson/Getty Images)
Droughts are increasingly common and more severe because of climate change, as warmer air causes greater evaporation and precipitation is affected by extremes of drought and heavy rain. The Midwestern drought has become worse in the last month due to light rainfall. Most of the region has received only between 5% and 50% of its normal precipitation.
“While the recent rapid intensification of drought has been most prominent across the Midwest, severe drought has persisted for up to two years across portions of the Missouri River Basin/Great Plains,” NIDIS noted.
The Midwest is not the only region in the country experiencing long-running drought. Much of the West is in the grip of a 22-year drought that is causing water levels in reservoirs on the Colorado River to drop to what the United Nations Environment Programme described in August as “dangerously low levels.”
Even typically wet regions such as the Northeast experienced drought this summer, which featured record-breaking heat waves, wildfires and droughts across the Northern Hemisphere. Dropping water levels in lakes and rivers due to droughts have also exposed long-buried secrets from bodies in Lake Mead in Nevada to dinosaur prints in Texas, Nazi warships in Serbia and ancient Buddhist statues in China.
Doctors say ‘fossil fuel addiction’ kills, starves millions
Seth Borenstein – October 25, 2022
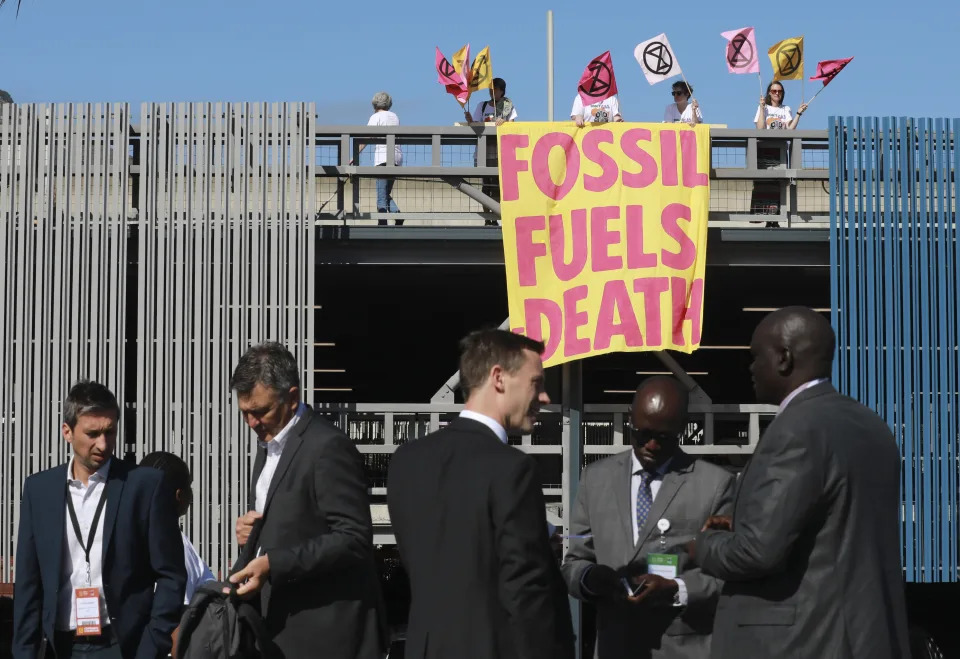
The sun sets behind a coal-fired power plant in Gelsenkirchen, Germany, Oct. 22, 2022. A new report from doctors and other health experts says the world’s fossil fuel addiction is making the world sicker and is killing people. (AP Photo/Michael Sohn, File)A child is weighed at a camp for displaced people amid drought on the outskirts of Dollow, Somalia, Sept. 19, 2022. Extreme weather from climate change triggered hunger in vulnerable populations worldwide as the world’s “fossil fuel addiction” degrades public health each year, doctors reported in a new study. (AP Photo/Jerome Delay, File)Climate activists from Extinction Rebellion hold a placard as they protest at the Africa Energy Week conference, foreground, in Cape Town, South Africa, Oct. 20, 2022. A new report from doctors and other health experts says the world’s fossil fuel addiction is making the world sicker and is killing people. (AP Photo/Nardus Engelbrecht, File)
Extreme weather from climate change triggered hunger in nearly 100 million people and increased heat deaths by 68% in vulnerable populations worldwide as the world’s “fossil fuel addiction” degrades public health each year, doctors reported in a new study.
Worldwide the burning of coal, oil, natural gas and biomass forms air pollution that kills 1.2 million people a year, including 11,800 in the United States, according to a report Tuesday in the prestigious medical journal Lancet.
“Our health is at the mercy of fossil fuels,” said University College of London health and climate researcher Marina Romanello, executive director of the Lancet Countdown. “We’re seeing a persistent addiction to fossil fuels that is not only amplifying the health impacts of climate change, but which is also now at this point compounding with other concurrent crises that we’re globally facing, including the ongoing COVID-19 pandemic, the cost-of-living crisis, energy crisis and food crisis that were triggered after the war in Ukraine.”
In the annual Lancet Countdown, which looks at climate change and health, nearly 100 researchers across the globe highlighted 43 indicators where climate change is making people sicker or weaker, with a new look at hunger added this year.
“And the health impacts of climate change are rapidly increasing,” Romanello said.
In praising the report, United Nations Secretary-General Antonio Guterres put it even more bluntly than the doctors: “The climate crisis is killing us.”
New analysis in the report blamed 98 million more cases of self-reported hunger around the world in 2020, compared to 1981-2010, on “days of extreme heat increasing in frequency and intensity due to climate change.”
Researchers looked at 103 countries and found that 26.4% of the population experienced what scientists call “food insecurity” and in a simulated world without climate change’s effects that would have only been 22.7%, Romanello said.
“Can I say that every bit of food insecurity is due to climate change? Of course not. But we think that in this complex web of causes, it is a very significant contributor and it’s only going to get worse,” said pediatrician Dr. Anthony Costello, Lancet Countdown co-chair and head of the University College of London’s Global Health Institute.
Computerized epidemiology models also show an increase in annual heat related deaths from 187,000 a year from 2000 to 2004 to an annual average of 312,000 a year the last five years, Romanello said.
When there’s a heat wave, like the record-shattering 2020 one in the Pacific Northwest or this summer’s English heat wave, emergency room doctors know when they go to the hospital “we’re in for a challenging shift,” said study co-author Dr. Renee Salas, a Boston emergency room physician and professor at the Harvard School of Public Health.
The air pollution from burning coal, oil and gas also pollutes the air, causing about 1.2 million deaths a year worldwide from small particles in the air, the scientists and report said. The 1.2 million figure is based on “immense scientific evidence,” Harvard’s Salas said.
“Burning gas in cars or coal in electricity plants have been found to cause asthma in children and cause heart problems,” Salas said.
“Prescribing an inhaler isn’t going to fix the cause of an asthma attack for a young boy living next to a highway where cars are producing dangerous pollutants and climate change is driving increases in wildfire smoke, pollen and ozone pollution,” Salas said.
Both air pollution and heat deaths are bigger problems for the elderly and the very young and especially the poor, said University of Louisville environmental health professor Natasha DeJarnett, a study co-author.
Sacoby Wilson, a professor of environmental health at the University of Maryland who wasn’t part of the report, said the Lancet study makes sense and frames climate change’s effects on health in a powerful way.
“People are dying now as we speak. Droughts, desertification, not having food, flooding, tsunamis,” Wilson said. “We’re seeing what happened in Pakistan. What you see happening in Nigeria. ”
Both Wilson and emergency room physician and professor of medicine at the University of Calgary Dr. Courtney Howard, who wasn’t part of the study, said report authors are correct to call the problem an addiction to fossil fuels, similar to being addicted to harmful drugs.
The Lancet report shows the increasing deaths from air pollution and heat yet people are “continuing in habitual behavior despite known harms,” which is the definition of addiction, Howard said. “Thus far our treatment of our fossil fuel addiction has been ineffective.”
“This isn’t a rare cancer that we don’t have a treatment for,” Salas said. “We know the treatment we need. We just need the willpower from all of us and our leaders to make it happen.”
Most in US want more action on climate change: AP-NORC poll
Daly and Nuha Dolby – October 24, 2022
WASHINGTON (AP) — Nearly two-thirds of Americans think the federal government is not doing enough to fight climate change, according to a new poll that shows limited public awareness about a sweeping new law that commits the U.S. to its largest ever investment to combat global warming.
Democrats in Congress approved the Inflation Reduction Act in August, handing President Joe Biden a hard-fought triumph on priorities that his party hopes will bolster prospects for keeping their House and Senate majorities in November’s elections.
Biden and Democratic lawmakers have touted the new law as a milestone achievement leading into the midterm elections, and environmental groups have spent millions to boost the measure in battleground states. Yet the poll by The Associated Press-NORC Center for Public Affairs Research finds that 61% of U.S. adults say they know little to nothing about it.
While the law was widely heralded as the largest investment in climate spending in history, 49% of Americans say it won’t make much of a difference on climate change, 33% say it will help and 14% think it will do more to hurt it.
The measure, which passed without a single Republican vote in either chamber, offers nearly $375 billion in incentives to accelerate expansion of clean energy such as wind and solar power, speeding the transition away from fossil fuels such as oil, coal and natural gas that largely cause climate change.
Combined with spending by states and the private sector, the law could help shrink U.S. carbon emissions by about two-fifths by 2030 and chop emissions from electricity by as much as 80%, advocates say.
Michael Katz, 84, of Temple, New Hampshire, said he thinks Biden has “done an amazing amount of work” as president. “I’m sort of in awe of what he’s done,” said Katz, a Democrat and retired photographer. Still, asked his opinion of the Inflation Reduction Act, Katz said, “I’m not acquainted with” it.
After learning about the law’s provisions, Katz said he supports increased spending for wind and solar power, along with incentives to purchase electric vehicles.
Katz said he supports even stronger measures — such as restrictions on rebuilding in coastal areas damaged by Hurricane Ian or other storms — but doubts they will ever be approved.
“People want their dreams to come true: to live near the ocean in a big house,” he said.
Leah Stokes, an environmental policy professor at the University of California, Santa Barbara, said she was not surprised the climate law is so little known, despite massive media coverage when it was debated in Congress, approved and signed by Biden.
The law was passed during the summer, when people traditionally pay less attention to news, “and it takes time to explain it,” especially since many of the law’s provisions have not yet kicked in, Stokes said.
Biden and congressional Democrats “delivered in a big way on climate,” she said, but now must focus on helping the public understand the law and “winning the win.”
Meredith McGroarty, a waitress from Pontiac, Michigan, said she knew little about the new law but supports increased climate action. “I have children I’m leaving behind to this world,” she said.
McGroarty, 40, a Democrat, urged Biden and other leaders to talk more about the climate law’s “effects on normal, everyday people. Let us know what’s going on a little more.”
Americans are generally more likely to support than oppose many of the government actions on climate change included in the law, the poll shows. That includes incentives for electric vehicles and solar panels, though relatively few say they are inclined to pursue either in the next three years.
About half of Americans think government action that targets companies with restrictions is very important, the poll shows, while about a third say that about restrictions on individuals. A majority of Americans, 62%, say companies’ refusal to reduce energy use is a major problem for efforts to reduce climate change, while just about half say people not willing to reduce their energy use is a major problem.
Slightly more than half also say it’s a major problem that the energy industry is not doing enough to supply power from renewable sources such as wind and solar, and about half say the government is not investing enough in renewable energy.
Overall, 62% of U.S. adults say the government is doing too little to reduce climate change, while 19% say it’s doing too much and 18% think it’s doing the right amount.
Democrats are more likely than others to think the federal government is doing too little on climate: 79% say that, compared to 67% of independents and 39% of Republicans. About three-quarters of Black and Hispanic Americans think there’s too little action, compared to about half of white Americans.
And about three-quarters of adults under 45 think there’s too little action on climate, significantly higher than the roughly half of those older who think that.
Robert Stavins, a professor of energy and economic development at the Harvard Kennedy School, said it makes sense for the government to step in to promote renewable energy on a large scale.
“Individual action is not going to be sufficient in 10 or even 20 years,” he said. “You need government policies to create incentives for industry and individuals to move in a carbon-friendly direction.”
Americans want to own a car, “and they are not going to buy one that’s expensive,” Stavins said, so government needs to lower costs for electric vehicles and encourage automakers to produce more EVs, including widespread availability of charging stations. Biden has set a goal to install 500,000 charging stations across America as part of the 2021 infrastructure law.
On renewable energy, nearly two-thirds of U.S. adults say offshore wind farms should be expanded, and about 6 in 10 say solar panel farms should be expanded. Biden has moved to expand offshore wind and solar power as president.
Americans are divided on offshore drilling for oil and natural gas. Around a third say such drilling should be expanded, while about as many say it should be reduced; another third say neither.
Republicans were more likely than Democrats to be in favor of expanding offshore drilling, 54% to 20%.
The poll of 1,003 adults was conducted Sep. 9-12 using a sample drawn from NORC’s probability-based AmeriSpeak Panel, which is designed to be representative of the U.S. population. The margin of sampling error for all respondents is plus or minus 4.0 percentage points.
US military to begin draining Pearl Harbor pipelines
Audrey McAvoy – October 24, 2022
JOINT BASE PEARL HARBOR-HICKAM, Hawaii (AP) — The U.S. military said Monday it’s ready to begin draining 1 million gallons (3.79 million liters) of fuel from three pipelines as part of an initial step toward closing a World War II-era fuel storage facility that leaked petroleum into Pearl Harbor’s tap water last year.
The pipelines run about 3 miles (4.83 kilometers) from the Red Hill Bulk Fuel Storage Facility in the mountains above Pearl Harbor down to the military base.
Starting Tuesday, the military will spend six days draining the pipelines one by one. Fuel is expected to move through the pipes for a total of 12 hours during the six days.
The fuel has been sitting in the pipes since the military suspended use of the Red Hill facility last year after it leaked petroleum into a drinking water well serving 93,000 people in and around Joint Base Pearl Harbor-Hickam.
Shortly after, the state Department of Health ordered the military to drain fuel from Red Hill and shut the facility down. The military says 104 million gallons remain in the tanks themselves. It aims to remove this fuel by July 2024 after it makes necessary repairs to be able to drain the tanks safely.
Navy Rear Adm. John Wade, the commander of Joint Task Force Red Hill, said the state Department of Health and the U.S. Environmental Protection Agency reviewed and approved the military’s plan to drain the pipelines. A third-party contractor also checked the plans, he said.
The most dangerous aspect of draining the pipelines is the potential for fuel to spill and enter the aquifer, Wade told reporters as a news conference.
“So everything that we’ve done, every focus of effort for the planning and the rehearsals has been focused on mitigating any chance of a spill,” he said.
The Red Hill facility sits just 100 feet (30 meters) above one of Honolulu’s most important drinking water aquifers.
Hawaii officials are concerned that last year’s spill contaminated the aquifer and are worried that any future spills would also pollute the aquifer, which normally supplies more than 20% of the water consumed in Honolulu.
Wade said representatives from the Department of Health and the EPA will be on hand while military drains the pipelines.
Task force members trained individually and as groups on how to respond if fuel spills while the pipelines are being drained, he said.
It found operator error caused a pipe to rupture on May 6, 2021 when fuel was being transferred between tanks. This caused 21,000 gallons (80,000 liters) of fuel to spill. Most of it flowed into a fire suppression line and sat there for six months, causing the line to sag.
Then on Nov. 20, a cart rammed into the sagging line, releasing 20,000 gallons (75,700 liters) of fuel. A team thought they recovered all of this fuel, but they missed about 5,000 gallons (19,000 liters). Fuel they missed flowed into a French drain and from there into the drinking water well.
Fuel from the three pipelines will go to above-ground storage tanks and fuel barges which will then supply Air Force jets and Navy ships at the base, officials said.
Pediatric hospital beds are filling up as RSV spreads across the US. Here are the symptoms to look out for and who’s most at risk of getting seriously ill.
Catherine Schuster-Bruce – October 24, 2022
In severe cases, a patient with RSV may need to be given oxygen, a breathing tube, or be put on a ventilator to help them breathe.Marijan Murat/picture alliance
Difficulty breathing and dehydration could be signs that a child is sick with RSV.
Confirmed RSV cases in the US have increased in recent weeks.
RSV usually causes a mild illness, but can be serious, particularly in infants and older people.
Difficulty breathing and dehydration are among the signs of respiratory syncytial virus that parents should look out for, doctors say, as pediatric hospital beds fill up across the country amid an unusual outbreak of the illness.
RSV typically causes mild, flu-like symptoms that get better within weeks without treatment, according to the Centers for Disease Control and Prevention. However, it can be serious, especially for infants and older people, with the potential to cause pneumonia and inflammation of the small airways called bronchiolitis, which can lead to respiratory failure and death.
The CDC estimates that around 58,000 children younger than 5 years are hospitalized with the virus each year.
“RSV can be super dangerous for some young infants and younger kids, particularly those that are less than 2 years of age,” Dr. Priya Soni, an assistant professor of pediatric infectious diseases at Cedars Sinai Medical Center, told CNN.
CDC data shows that confirmed cases in the US have increased in recent weeks, and doctors across the country have reported high numbers of kids sick with RSV, as well as other illnesses.
Dr. Jesse Hackell, chair on the committee on practice and ambulatory medicine for the American Academy of Pediatrics, told The Washington Post that it was “very hard to find a bed in a children’s hospital — specifically an intensive care unit bed for a kid with bad pneumonia or bad RSV because they are so full.”
Dr. Juan Salazar, physician in chief of Connecticut Children’s Medical Center, told The Hill RSV cases are expected to rise in fall, but they started spiking in early September and have risen exponentially since, which he hadn’t seen before.
Hospitals in more than 24 states around the country, including Rhode Island, Washington, Colorado, Texas, Ohio, Louisiana, New Jersey, Massachusetts as well as the District of Columbia, told ABC News they are struggling with more pediatric cases than normal of infections other than COVID.
“We’re seeing RSV infections going rampant all throughout the country,” Mora, a volunteer medical spokesperson for the American Lung Association, told CNN.
Seek medical help if your child is having difficulty breathing or seems dehydrated
According to the CDC, early symptoms of RSV include: a runny nose, a cough, which may progress to wheezing, and decreased appetite.
Infants younger than 6 months may have one symptom like: irritability, decreased activity, decreased appetite, or pauses while breathing. RSV may not always cause a fever, according to the CDC.
Doctors told CNN that parents should seek medical attention if a child has any signs of labored breathing or dehydration including: breathing harder or faster, the belly moving up and down, nasal flaring, and diapers that are less wet than usual.
Infants who are premature, aged six months and younger, have birth lung or heart defects, or neuromuscular disorders that make it difficult to clear secretions are most at risk of getting sick, according to the CDC. Most kids younger than 2 years of age will catch it without getting seriously unwell.
Adults with compromised immune systems and older adults, particularly those with underlying heart or lung diseases, are also at higher risk of getting seriously ill from RSV.
RSV can spread when an infected person coughs or sneezes
A person can catch RSV when virus droplets from an infected person’s cough or sneeze gets into their eyes, nose, or mouth.
Dr. Elizabeth Mack, division chief of Pediatric Critical Care at the MUSC Children’s Health, said in a press release that babies often get RSV from someone in the household: “It’s common that the older sibling goes to day care, went to the store, went to a party, came home, had a runny nose and then the infant got really sick.”
Covering your nose and mouth when you sneeze can help prevent RSV from spreading
People can help to prevent RSV by: covering coughs and sneezes with a tissue or a sleeve, and regularly washing hands for at least 20 seconds.
Mack said that it was a “good idea” to wash your hands before interacting with a newborn, “regardless of whether you’re symptomatic or have been around anybody who’s sick.”
“If somebody’s sick, avoid close contact, avoid sharing utensils or food. Frequently touched surfaces should be cleaned if somebody in the household is sick,” she said.
Parents can treat RSV at home with pain killers
There is no specific treatment for RSV. For many, it is a mild illness that can be treated at home. Parents can give their kids non-aspirin pain killers, like ibuprofen, ensure they drink enough, and speak with a healthcare provider before using non-prescription cold remedies, according to the CDC.
Babies under the age of 6 months or older people may need hospital treatment if they become dehydrated or have trouble breathing.
In severe cases, a patient may need to be given oxygen, a breathing tube, or be put on a ventilator to help them breathe, which usually lasts a few days, the CDC website states.
There isn’t yet a widely available vaccine for RSV, but scientists are working on it.
“The unfortunate thing is that there is a vaccine against RSV, but it’s only available to babies with high-risk conditions. Vaccinations begin in October, but the surge hit early,” Mack said.